Get Indexology® Blog updates via email.

In This List

S&P 5-YEAR DIVIDEND SNAPSHOT (and know when your paycheck comes in)

U.S. Domestic Dividends Set Record Increases

What Is So Super About Chinese Demand?

Food Drives March

March On

S&P 5-YEAR DIVIDEND SNAPSHOT (and know when your paycheck comes in)

Contributor Image
Howard Silverblatt

Senior Index Analyst, Product Management

S&P Dow Jones Indices

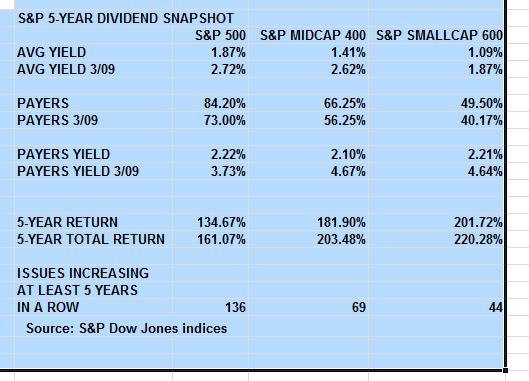
March marked the fifth anniversary from the Bear market low. Dividends have not only recovered from their bottom, but are setting new records. Yields are less, but relative to other instruments they remain competitive, and have a much lower tax rate. Two observations that became apparent are the risk-reward trade off and the yields. For the S&P indices, the large-cap market has more issues which pay a dividend and more issues which increase year-after-year. On a risk-reward note, the S&P 500 offers a higher yield, with a richer history of increases. However, that security of income comes at the cost of capital appreciation, with the S&P Small and Mid caps having returned more in stock price (and total return).

pic3

pic6

The posts on this blog are opinions, not advice. Please read our Disclaimers.

U.S. Domestic Dividends Set Record Increases

Contributor Image
Howard Silverblatt

Senior Index Analyst, Product Management

S&P Dow Jones Indices

Data is for U.S. Domestic Common Stock, not just the S&P 500
U.S. domestic common issues set a first quarter record for dividend increases, as the ‘shareholder’ return theme continued. Increases have been made easier by record earnings and record cash holdings. Additionally, many issues (especially large-caps) have heard the knocking at the boardroom door – from activists. I expect strong dividend growth to continue in 2014, as ‘shareholder return’ continues to be the battle cry from boardrooms, and those knocking at the boardroom door. I expect the actual cash payments for 2014 to post a double-digit increase over the record setting 2013 level. Yields remain competitive, with qualified dividends have a tax advantage.

For U.S. domestic common stock in Q1 2014:
U.S. domestic common issues set a first quarter record for dividend increases, as the ‘shareholder’ return theme continued.

Record number of increases (increases, extras, initiations, resumptions), as 1,078 issues increase, surpassing the record of 1,069 set in 1979 (records start in 1955) 102 issues decrease (decrease, suspend), verses 139 in Q1,’13

Q1,’14 indicated dividend rate increases $17.8 billion, a 22.9% rise over the Q1,’13 $14.5 billion gain 12 month March 2014 increases $60.0 billion verses 2013’s $56.7 billion

The percentage of dividend paying issues (U.S. domestic common, ASE, NYSE, NASD) decreased to 47.0% from Q4,’13’s 47.7% (Q3,’13’s 47.4%, Q2,’13’s 47.3%, but up from Q1,’13’s 46.1%)
The number of payers went up, but the number of trading issues went up much more 84.2% of the S&P 500 (421 issues) pay a cash dividend, the most since Sep,’98 (was 473 when I started in May,’77), and all of the DJIA30 issues pay

Yields slightly increased, as the market’s growth slowed (but there was price appreciation) Weighted dividend yield at the end of Q1,’14 was 2.48%, compared to 2.44% for Q4,’13, and Q1,’13 was 2.61%

Dividend yields remain relatively attractive compared to other instruments such as corporate bonds, treasuries, and bank CDs, especially considering the lower (permanent) tax rate advantage.

Payout rates (dividends as a percentage of As Reported GAAP earnings) remain low, as companies payout record amounts, but payout less as a percentage of what they are making -> cash sets another record

U.S. common stocks set a Q1 record (from 1955) for increases, beating out 1979 (fyi: 10-year is 2.68%, was 10.33% in ’79 and then went up to 15.8%; 500 yield is 1.9% and was 5.2%)
pic1

pic2

The posts on this blog are opinions, not advice. Please read our Disclaimers.

What Is So Super About Chinese Demand?

Contributor Image
Jodie Gunzberg

Former Managing Director, Head of U.S. Equities

S&P Dow Jones Indices

We have heard for many years now about the Chinese super-cycle that supported commodity prices since 1999 and we have also heard many debates about whether it has ended.  So if it has ended what now? How huge is the impact on commodity prices?

That all depends on the level of inventories that result from the combination of supply and demand. Theoretically if there were no inventories or supply, it wouldn’t matter how much Chinese demand fell. They could demand all they wanted but there would be no price impacts if there were no supply or inventories.  Realistically this is not the case but there are shortages in various commodities, so the slowdown in Chinese demand growth matters more for some commodities than others.

Another point to remember is that Chinese demand does not slow equally in all areas. Construction, automobile demand and food demand all require different natural resources, so it is understandable that copper, palladium, gasoline and soybeans may not move together. China has also been known to stockpile resources at various times, which may influence the available inventories like in cotton last year.

First let’s take a look at the slowdown in GDP growth from China.  In 2013 the growth was 7.7%, roughly the same as in 2012, which is also close to 1998-99 levels and almost half as much as in 2007 when it was 14.2%. There is no correlation (0.04) between the total returns of the S&P GSCI and Chinese GDP growth, while there is only slightly positive correlation of the commodities to the GDP growth of the US at 0.23 and UK at 0.30.

Source: S&P Dow Jones Indices and Bloomberg. Data from Jan 1978 to Dec 2014. Past performance is not an indication of future results. This chart reflects hypothetical historical performance. Please note that any information prior to the launch of the index is considered hypothetical historical performance (backtesting).  Backtested performance is not actual performance and there are a number of inherent limitations associated with backtested performance, including the fact that backtested calculations are generally prepared with the benefit of hindsight.
Source: S&P Dow Jones Indices and Bloomberg. Data from Jan 1978 to Dec 2013. Past performance is not an indication of future results. This chart reflects hypothetical historical performance. Please note that any information prior to the launch of the index is considered hypothetical historical performance (backtesting). Backtested performance is not actual performance and there are a number of inherent limitations associated with backtested performance, including the fact that backtested calculations are generally prepared with the benefit of hindsight.

Further, let’s take a look at the supply and demand situations a few of the mainstay commodities. According to IEA’s March Oil Market Report, although the OPEC and Non-OPEC supply has increased roughly 2 mb/d yoy, it is against a backdrop of staggering inventory draws from a cold snap in the US. From this, the oil stock deficit to the seasonal average is at 154 mb, its widest in more than a decade.

International Energy Agency (IEA) March 2014 Oil Market Report.

Now let’s evaluate the demand side of oil, and again, what does a slowdown in Chinese demand mean? It depends on the commodity, even within the oil complex. For example gasoil has had the slowest growth yoy in 2013 of -1.6% and 2.5% (projected by the IEA) in 2014 since the demand for transporting coal has dropped. This translated into 54 kb/d coming off demand in 2013 but 83 kb/d coming back on in 2014 (projected by the IEA). However, gasoline demand has been relatively strong with a 6.5% growth in 2013 and 6.2% (projected by the IEA) in 2014 adding up to 129 kb/d in each year of 2013 and 2014 fueled by car sales.

Chinese demand also is relative to the rest of the world. They still have the highest demand growth in the world for oil and even if it is slowing, they are still consuming an additional 344 kb/d in 2014 (projected by the IEA) after a 278 kb/d incremental increase in 2013. The 344 kb/d is less than half of the consumption of the top 10 consumers in the world that the IEA projects will consume 834 kb/d more in 2014. It is actually the slowdown in the US which should be highlighted, where the demand growth is slowing the most, dropping to just 0.5% growth adding just 96 kb/d only behind Japan and Korea in 2014 (according to the IEA).  The world should also watch demand coming from India, Russia, Brazil and Saudi Arabia, which taken together are more powerful than China on the demand front with an IEA projection of an additional 364 kb/d in 2014.

This is all interesting but oil is not the only commodity where the possible Chinese super-cycle bust doesn’t really matter. There are mixed impacts on copper, and as I have pointed out before, copper is not the best indicator of economic health. Currently inventories are at relatively low levels despite weaker Chinese demand.

Copper Supply

Despite this inventory drop, the S&P GSCI Copper has fallen 9.05% this year.  Undoubtedly, some of this loss is due to slower Chinese demand; however, more factors are at play. Copper is used as collateral for high risk loans where cash might not be available and the credit default caused a big scare. The bigger question surrounding copper’s future is probably around whether producers can deliver the supply they plan this year and whether Indonesia relaxes its export bans on copper concentrates.

This is evidence of the impacts of low inventories we have been seeing recently.  Commodities this time around, in the new cycle, might not be primarily driven by the super-cycle of Chinese demand growth and may be more impacted by the supply side.

For further evidence, let’s examine the agriculture and livestock. Take a look at the chart below of hog and pig supply. A slowdown in Chinese demand is just not powerful enough to kill the virus driving the rally, where the S&P GSCI Lean Hogs is up 42.4% YTD.

USDA National Agricultural Statistics Service. http://www.nass.usda.gov/Newsroom/2014/03_28_2014.asp

The S&P GSCI Agriculture has also spiked this year, up 15.1% YTD. This has been mainly due to weather that shocked the supply, again outpacing the demand drop from China due to the ban on GMO corn. It’s interesting that in the recent USDA report on World Agricultural Supply and Demand Estimates the focus is much more on China as a supplier than a consumer. Despite this, Agweb pointed out that China is still the third largest importer of US corn and the USDA projects imports to triple from 236 million bushels in 2014/5 to 836 million bushels by 2023. Some say a similar pattern in soybeans could follow.  That seems like super demand growth even with the end of a super-cycle.

The posts on this blog are opinions, not advice. Please read our Disclaimers.

Food Drives March

Contributor Image
Jodie Gunzberg

Former Managing Director, Head of U.S. Equities

S&P Dow Jones Indices

Commodities continue their comeback as supply shocks prevail over demand growth concerns from China. The backwardation (indicative of shortage), measured by roll yield or the excess return minus the spot return, has not only persisted from February into March but increased.  March’s roll yield of 26 basis points more than doubled February’s roll yield of 10 basis points, bringing a MTD gain of 14 basis points to increase the S&P GSCI YTD return to 2.9%.  While we have seen some backwardation in the past few summers, we have not seen it this early in the year since 2004 – the last year of low inventories until now.  In 2004, the S&P GSCI returned 17.3%.

Source: S&P Dow Jones Indices. Data from Jan 1970 to March 2014. Past performance is not an indication of future results. This chart reflects hypothetical historical performance. Please note that any information prior to the launch of the index is considered hypothetical historical performance (backtesting).  Backtested performance is not actual performance and there are a number of inherent limitations associated with backtested performance, including the fact that backtested calculations are generally prepared with the benefit of hindsight.
Source: S&P Dow Jones Indices. Data from Jan 1970 to March 2014. Past performance is not an indication of future results. This chart reflects hypothetical historical performance. Please note that any information prior to the launch of the index is considered hypothetical historical performance (backtesting). Backtested performance is not actual performance and there are a number of inherent limitations associated with backtested performance, including the fact that backtested calculations are generally prepared with the benefit of hindsight.

Don’t let the term structure fool you, though.  There is a misperception that the term structure determines the total return.  While the roll yield is a highly significant attribute to the total return, it is not the only driver.  Price return and collateral yield are also included so that sometimes a positive return is realized despite contango.  Although on average in this chart, there are no negative average monthly returns with backwardation, it does happen.

Return Roll

Currently we are experiencing shifts in the curves that are not big enough to overcome price changes.  For example, the S&P GSCI Energy is in backwardation but is has a negative total return for the month of -1.2%.  Also the S&P GSCI Copper is in backwardation for the 5th month straight but its March total return was -5.3%.  It is hard to be a big copper bear with persistent backwardation like that unless a big supply comes to market.  On the flip side, the S&P GSCI Agriculture & Livestock is up 6.4% in March but is still showing slight contango.  The lean hogs, up 19.0% in March, had the fattest gain for the month, but is in contango (reflecting abundance and high storage costs), giving up 7.8% for a total return of 11.2%.

Earlier in the month, someone asked me if I had a food fetish after I had posted about coffee, cocoa, pork, cattle and corn.  Given the S&P GSCI has 24 commodities and 10 are food related (if you don’t count edible gold leaf confections), I answered maybe a half of a food fetish, but that the weather is causing all sorts of problems in the supply chain for food commodities, spiking prices across the S&P GSCI Agriculture & Livestock. The weather is also putting some of these commodities into backwardation earlier than normal, which might be even more profitable for an index investor.  


The posts on this blog are opinions, not advice. Please read our Disclaimers.

March On

Contributor Image
Howard Silverblatt

Senior Index Analyst, Product Management

S&P Dow Jones Indices

TAKEAWAYS & FYIs (commentary):

  • U.S.-Russian relations continued to decline, but markets didn’t see it as major issue; European markets have been more concerned about oil and gas sales from Russia, as Russia needs the currency and Europe needs the products
  • The Fed moved the conversation from stimulus ending to increasing interest rates, but after an initial negative impact the market accepted this (rate increases are at least a year away), just as it accepted the end of QE4-ever
  • Interest rates declined for Q1, as the 10-year fell to 2.72% from 3.03% (1.76% at the end of 2012)
  • Buybacks were flat for Q4 with fewer shares repurchased, but companies issued less, resulting in lower share counts and higher EPS
  • Activists continued on, as boards reacted: If you have people knocking on the board room door, you have to answer it or reinforce the door
  • Biotechnology declined, underperforming healthcare YTD: correction opportunity vs. bubble debate

Thought items:

  • It’s nice to have (new) paper money, as Facebook uses it for another $2B purchase, after last month’s $19B buy
  • It’s also a nice time to do an IPO – at least if you have profits (health care)
  • Starbucks will expand its evening wine and beer sales – a new twist on speak-easy (what would Maynard G Krebs buy?)

Key stats:

  • Cash set its sixth consecutive quarterly record for the S&P 500 Industrials (Old) at $1.3 trillion; 94 weeks of net income sitting on the books was making very little but attracting outsiders
  • Traders market: the index was up 1.30%, but 90 issues were up at least 10%, with 36 down at least 10% YTD (25.2% of the issues)

Key concept:

  • Q1 feeling (on the Street) is that the weather is an okay excuse for less than expected results, which increases the stakes on company guidance for Q2

The posts on this blog are opinions, not advice. Please read our Disclaimers.