Generally investors use covered calls to earn extra income from investments they think might not have much upside potential. For example, if a CEO has a very large stock holding in his or her company but doubts the stock price will increase (or decrease much), writing (selling) options on the stock to collect a premium may be a good solution to earn some extra income.
In the past few years, one of the index innovations has expanded on this concept for commodities in the S&P GSCI Covered Call Select. The index is an equally weighted composite of 10 single covered call commodity indices based on the liquidity in the options market, where the annual options volume must be at least 10% of the underlying commodity futures volume. The commodities included in the index currently are: coffee, corn, cotton, WTI crude oil, gold, natural gas, silver, soybeans, sugar, and wheat. The index intends to produce income and reduce volatility as well as negative roll yield from contango.
Overall, the option risk premium for the S&P GSCI Covered Call Select was 8.1% in the time frame from Mar 2003 – Jul 2013 (the period we have data for). See the chart below for the monthly premiums. 63% or 79/125 of the months had positive premiums where in 60% of months prior to 2008, 79% of months between 2008-9, and 58% of months post 2009 had positive premiums.
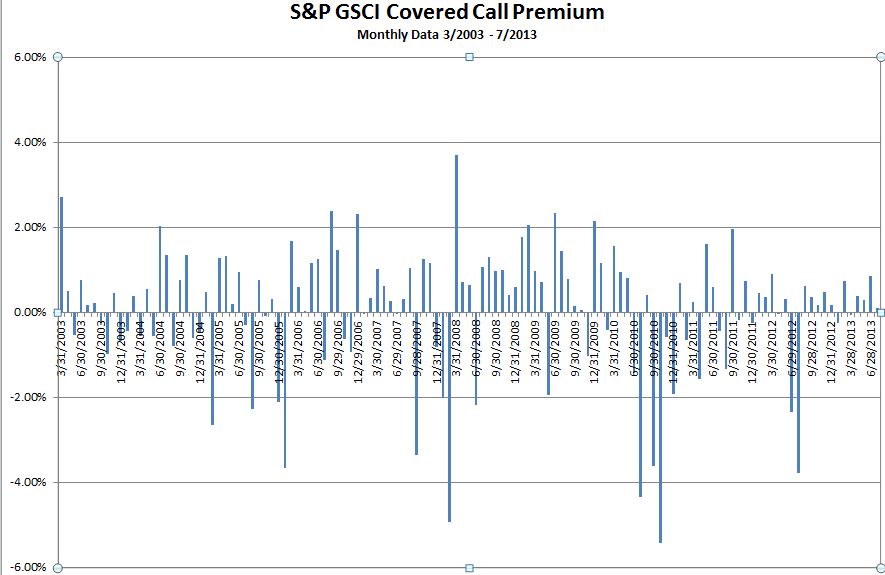
- Source: S&P Dow Jones Indices. Data from Mar 2003 to July 2013. Past performance is not an indication of future results. This chart reflects hypothetical historical performance. Please see the Performance Disclosure at the end of this document for more information regarding the inherent limitations associated with backtested performance.
While the broad index result is in-line with expectations, the results vary for single commodities, creating potential opportunity for positive alpha if the “calls” are correct. So, which covered calls were “good calls” and which were “bad calls”? During the entire time frame, the “good calls” were natural gas, coffee and WTI crude oil, and the “bad calls” were sugar, cotton, and soybeans.
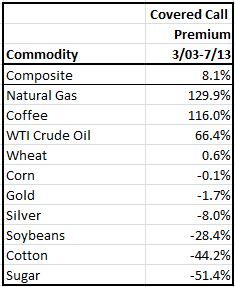
If one had created an alpha strategy by going long an average of the top 3 “good calls” and going short an average of the bottom 3 “bad calls”, the cumulative return over the period would have been 222.9%. Not too bad for a time frame where the S&P GSCI TR returned 5.0% and the S&P GSCI Covered Call Select TR returned 30.5%. 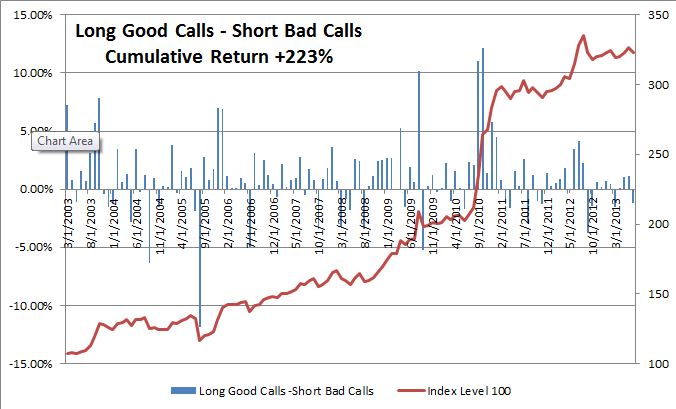
- Source: S&P Dow Jones Indices. Data from Mar 2003 to July 2013. Past performance is not an indication of future results. This chart reflects hypothetical historical performance. Please see the Performance Disclosure at the end of this document for more information regarding the inherent limitations associated with backtested performance.
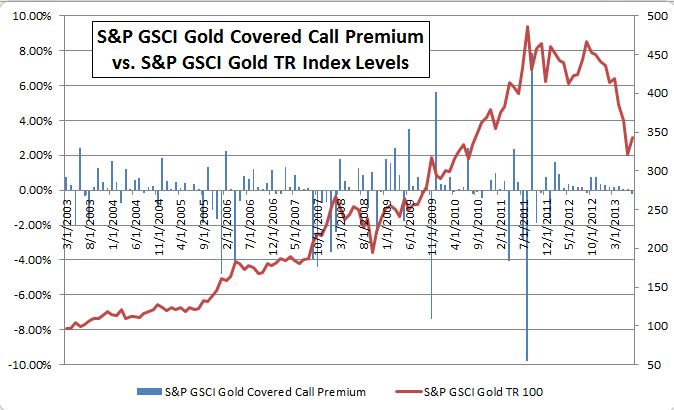
What does this mean about the behavior of covered call indices of single commodities? Let’s examine gold and WTI crude oil since they are popular commodities and represent a trend and a choppy market.
Notice in the chart below that plots the monthly covered call premiums versus the index levels of the commodity that there was a pretty clear uptrend until Aug 2011 that later reversed. This is the kind of behavior we would expect not to have a great result, and sure enough, the S&P GSCI Gold Covered Call Premium was negative slightly, down 1.7% over the period.
Now let’s look at WTI crude oil, which had much less of a trend despite a large spike and drop in the 2007-8 period. The covered call premium was significant, up 66.4% over the period, as we might expect of a covered call strategy in a relatively flat and choppy market, especially apparent in the 2004-6 and post 2009 periods. 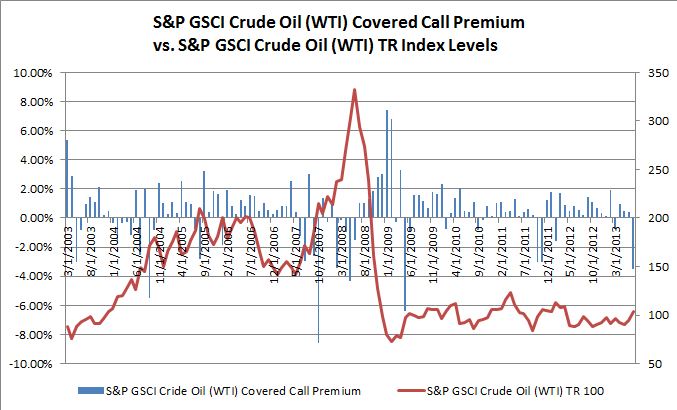
- Source: S&P Dow Jones Indices. Data from Mar 2003 to July 2013. Past performance is not an indication of future results. This chart reflects hypothetical historical performance. Please see the Performance Disclosure at the end of this document for more information regarding the inherent limitations associated with backtested performance
Let me know if there is analysis on other covered call commodities that you would like to see. Curious about what might be trending or choppy? Thanks for reading.