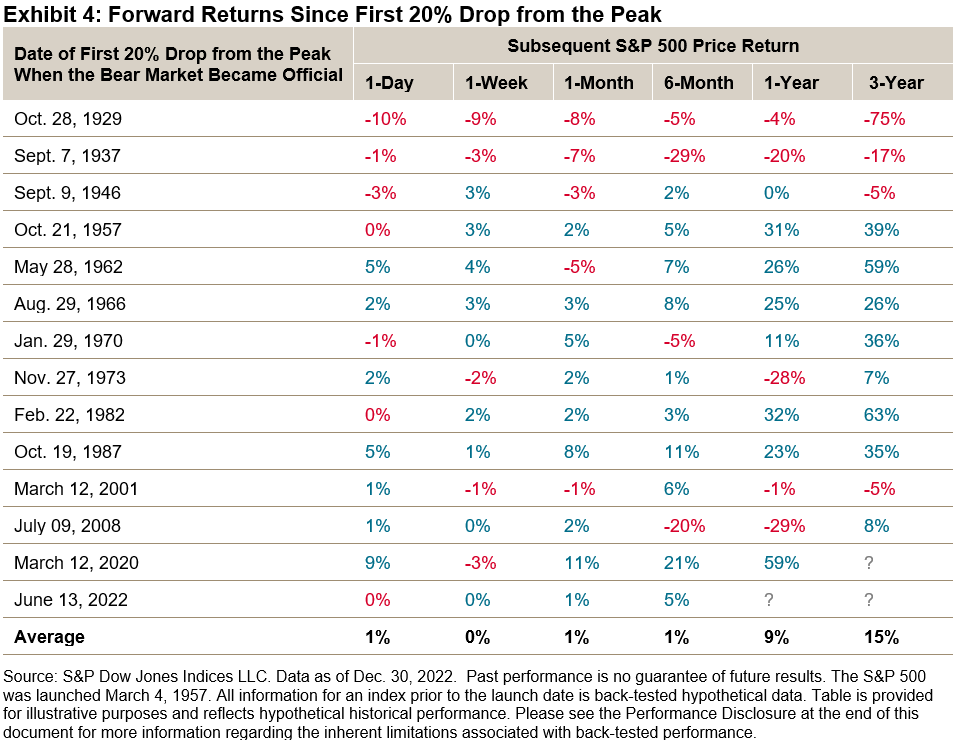
The S&P 500® Equal Weight Index launched on Jan. 8, 2003, so Sunday marked 20 years since the index first allowed investors to measure the performance of egalitarian allocations among S&P 500 constituents. The index is now tracked by various investment products globally, and it has potential benchmarking applications. Exhibit 1 shows that the S&P 500 Equal Weight Index has outperformed the S&P 500, both since January 2003 and when observing its back-tested history starting in the 1970s.
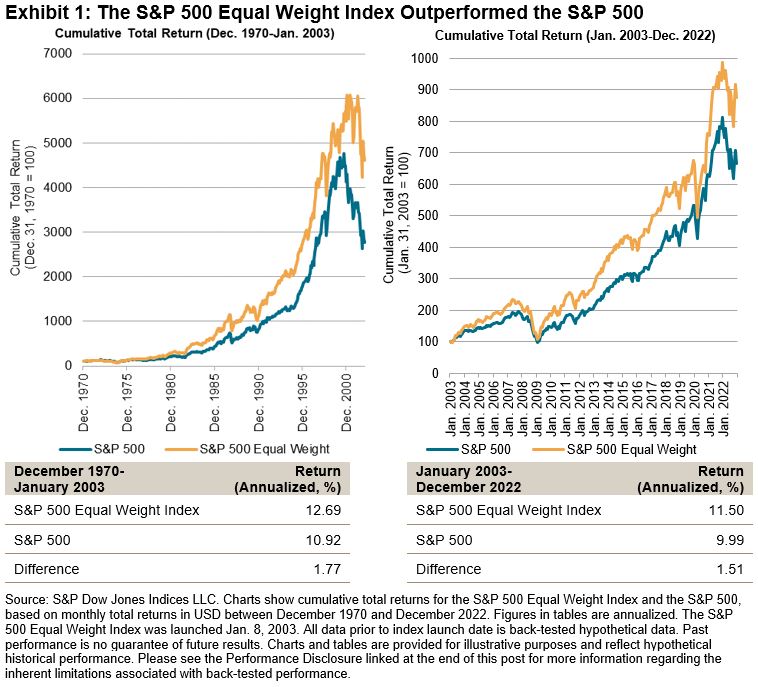
Arguably the biggest driver of the S&P 500 Equal Weight Index’s outperformance was its smaller size exposure. Having more (less) exposure to the smaller (larger) names in the S&P 500 explained over 50% of the S&P 500 Equal Weight Index’s relative returns, historically, and it was useful when exploring equal weight’s impact on risk/return. Indeed, it helped to explain the case for equal weight indexing amid the elevated concentration in S&P 500 constituents in recent years. Exhibit 2 illustrates the historical dynamic between changes in concentration and the relative performance of the equal weight index.
However, size exposure was far from the only source of outperformance in equal weight indices. For example, the S&P 500 Equal Weight Index’s anti-momentum and value factor tilts, along with its distinct sector exposures, helped it to beat the S&P 500 by 7% in 2022. More strategically, the equal weight index benefited from positively skewed equity returns: Exhibit 3 shows that for an average calendar year between 2003 and 2022, the index offered more exposure to the best-performing S&P 500 stocks.

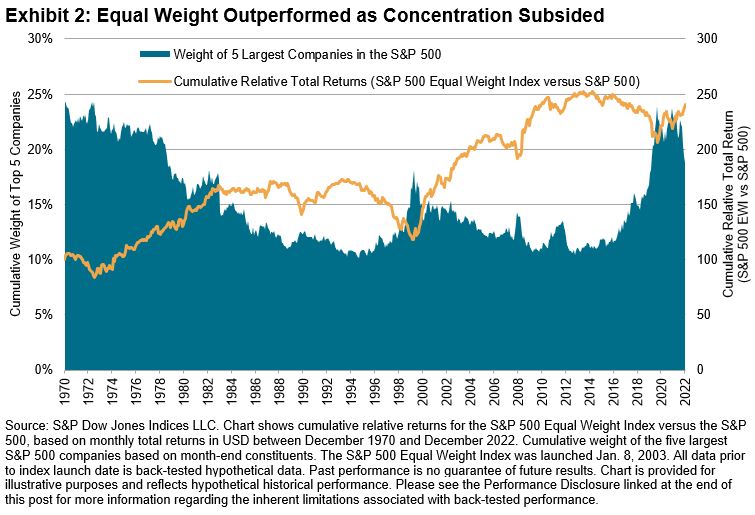
In addition to the potential relevance of the S&P 500 Equal Weight Index to those looking for large-cap U.S. equity exposure, there are several reasons why investors may wish to use the S&P 500 Equal Weight Index as a supplemental benchmark for large-cap U.S. equity managers. For example, the equal weight index may be a more suitable benchmark, given that it appears many active managers have historically been closer to equal weighting than cap weighting in their portfolio construction. Exhibit 4 illustrates that the S&P 500 Equal Weight Index set a higher standard for large-cap U.S. equity active managers to beat over various horizons ending June 30, 2022.

The S&P 500 Equal Weight Index’s 20th birthday offers a chance to reflect on its performance, characteristics and potential use cases. Here’s to the next 20 years!
The posts on this blog are opinions, not advice. Please read our Disclaimers.