Get Indexology® Blog updates via email.

In This List

Commodities Take a Break over the Northern Hemisphere Summer

Defense in the Balance

S&P U.S. Core Indices Mid-Year 2022: Analyzing Relative Returns to Russell

The Case for Dividend Aristocrats in Pan Asia

S&P 500 GARP Index: Growth at a Reasonable Price Anyone?

Commodities Take a Break over the Northern Hemisphere Summer

Contributor Image
Fiona Boal

Managing Director, Global Head of Equities

S&P Dow Jones Indices

The S&P GSCI fell 2.7% in August; renewed strength in agricultural commodities and the continued rally in natural gas were not sufficient to overcome a late-month decline in oil prices. After eight months, the benchmark commodities index is 32% higher YTD, defying higher interest rates and growing fears of a prolonged global economic slowdown.

The global energy sector remains rattled by the precarious position of the European power market. S&P GSCI German Power (Yearly) rallied 59.4% over the month, but it was 41.5% off its intra-month high, reflecting the realities of a physical market that is trying to wean itself off a feedstock (Russian natural gas) in a matter of months despite an original dependence that took decades to foster. Short-term alternatives such as coal and nuclear are unpalatable to many. Germany is scheduled to cease nuclear energy production at the end of the year. Government intervention looks likely to continue to direct and influence these markets.

In the petroleum complex, a relatively tight global supply picture competed with fears of an economic slowdown, a strong U.S. dollar and the likelihood of government intervention to address skyrocketing retail energy prices. Additionally, a drop in financial market participation in the major oil derivative markets has contributed to higher levels of volatility. The S&P GSCI Petroleum fell 6.0% over the month. Negotiations between the West and Iran on a nuclear pact are ongoing. It is not clear how quickly Iranian oil could flow into the global market if and when an agreement is reached. OPEC+ publicly mulled the prospect of output cuts late in the month to support prices even though the cartel is failing to pump anything close to its current targets.

Within industrial metals, the S&P GSCI Iron Ore and S&P GSCI Nickel both fell by sizeable amounts, 12.2% and 9.4%, respectively. These two metals are very important to the Chinese economy, and the price drops reflect the continued drop in August economic activity, with the latest purchasing manager’s index still in contractionary territory below 50. Rising cases of COVID-19 across all 31 mainland Chinese provinces continued to be an issue.

With the U.S. dollar breaking through to another 20-year high in August, gold prices continued their fall this quarter. The S&P GSCI Gold fell 2.9% after falling in July. This year, gold has not performed as it historically has in inflationary or risk-off environments. The S&P GSCI Silver fell 11.9% following the drops in industrial metals.

The S&P GSCI Grains rose 3.5%, with the S&P GSCI Corn rising 9.3%. Declining U.S. and European corn crop prospects helped prices increase with the lower supply. Cotton had its best monthly performance in more than a decade, with the S&P GSCI Cotton rallying 17.3%. The August USDA Crop Report made significant reductions to U.S. and global cotton supply estimates, and flooding in Pakistan in the later part of the month is expected to further affect global supplies of the natural fiber. The S&P GSCI Livestock fell 1.5% in August.

The posts on this blog are opinions, not advice. Please read our Disclaimers.

Defense in the Balance

Contributor Image
Craig Lazzara

Former Managing Director, Index Investment Strategy

S&P Dow Jones Indices

Balanced portfolios traditionally (and definitionally) hold a mix of stocks and bonds. Stocks have been the better-performing asset over time, but with a level of volatility that many investors find unacceptably high. Although bonds are usually included in a balanced portfolio more as a volatility dampener than a return enhancer, during the bull market in bonds that began in 1981, such defensive allocations did not require a major sacrifice in returns.

And then, 2022 happened.

In the first half of the year, investors were confronted with both falling stock prices (the S&P 500® declined by 20.0%) and rising interest rates (the 10-year U.S. Treasury rate more than doubled). After a respite in July, the same unfortunate combination has returned in August. The prospect of rising interest rates has led to increasingly bearish sentiment; in such an environment, investors may need a source of defense beyond bonds.

Defensive factor indices are designed precisely to perform this function. They can be characterized by what I like to call the “two Ps”—protection and participation. Defensive strategies, in other words, aim to mitigate losses in a declining market, while also participating in rising markets. Exhibit 1 shows that many factors were successful in attenuating the S&P 500’s losses in the first six months of the year; some even outperformed the bond market.

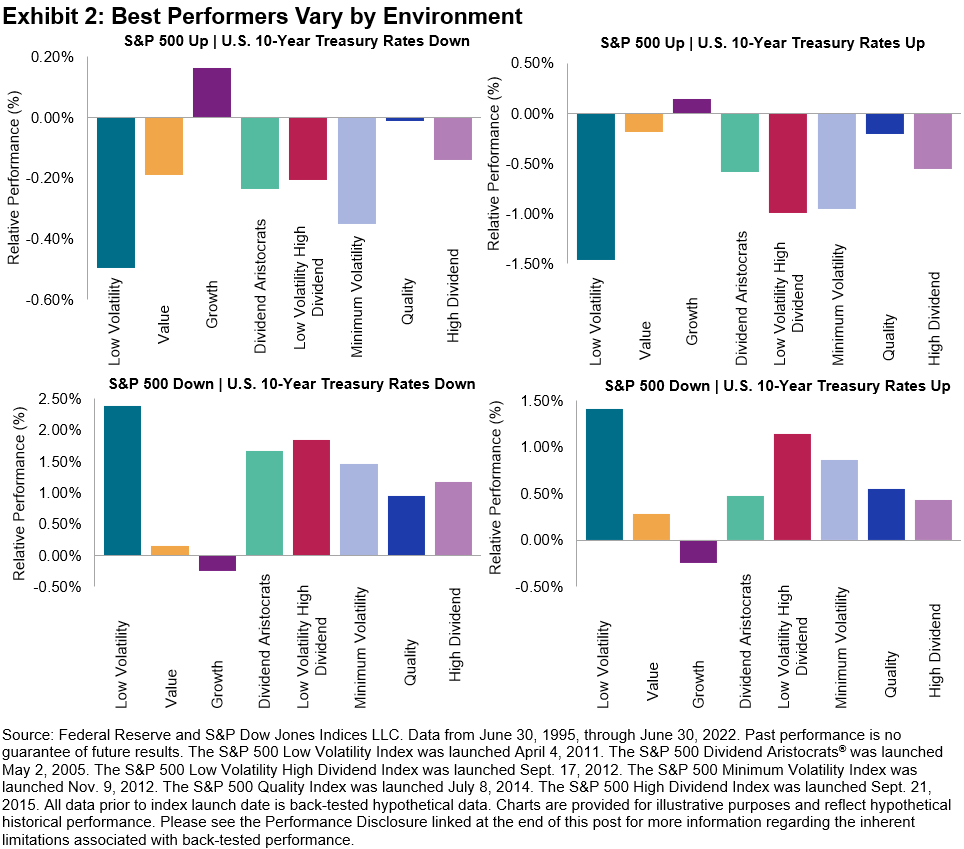
This effect was not an anomaly. Exhibit 2 shows the long-term history of the same set of factor indices. We observe relative performance in four distinct sets of months, separating rising stock markets from falling stock markets and rising interest rates from falling interest rates.

The most important observation about these scenarios is that the direction of the stock market matters much more than the direction of the bond market. Otherwise said, each panel looks more like the panel to which it is horizontally adjacent than the panel to which it is vertically adjacent. In months when the S&P 500 fell, Low Volatility and Low Volatility High Dividend were the best relative performers, and Growth was the worst, regardless of whether interest rates were rising or falling.

This means that a balanced portfolio might achieve two benefits by substituting a defensive factor index for a comprehensive market index such as the S&P 500. Most directly, if equity prices weaken, it’s likely that defensive factors will mitigate the damage to the portfolio’s return. Secondly, using a defensive factor for part of the equity allocation will reduce equity’s contribution to the balanced portfolio’s volatility. This means that the portfolio’s bond allocation can be reduced without adding to overall portfolio volatility. If interest rates continue to rise, reducing bond exposure may become an additional source of portfolio return.

The posts on this blog are opinions, not advice. Please read our Disclaimers.

S&P U.S. Core Indices Mid-Year 2022: Analyzing Relative Returns to Russell

Contributor Image
Fei Wang

Senior Analyst, U.S. Equity Indices

S&P Dow Jones Indices

In Q2 2022, the S&P 500®, S&P MidCap 400® and S&P SmallCap 600® all fell about 15%, continuing the declines from Q1 as of June 30, 2022 (see Exhibit 1). The S&P 500 experienced its worst first half since 1970.

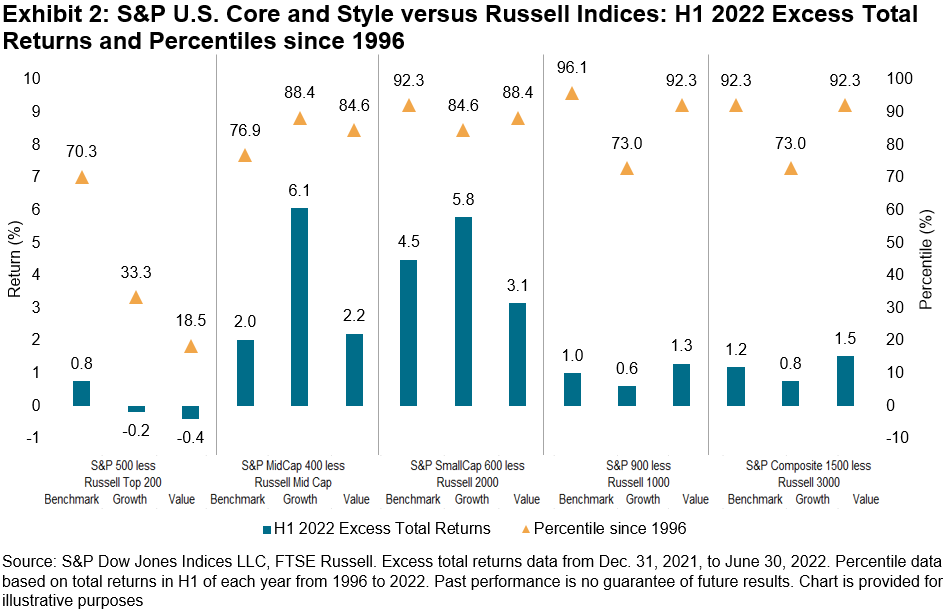
Amid the challenging environment, the S&P U.S. Core and Style Indices have generally proved more resilient than their respective Russell counterparts. As Exhibit 2 shows, the majority of S&P U.S. Core and Style Indices outperformed their Russell counterparts in H1 2022. For example, the S&P 900 posted the second largest margin against the Russell 1000 since 1996 (based on total returns in H1 each year), only trailing 1997. The S&P MidCap 400 Growth had the largest excess H1 returns since 2003, marking the 20th year in a row.

The outperformance of S&P U.S. Core and Style Indices in H1 2022 was not an uncommon phenomenon. S&P U.S. Core and Style Indices have typically outperformed in H1 of each year since 1996. Also, the outperformance from S&P DJI’s headline indices helped boost S&P Style Indices’ relative returns, highlighting the relevance of benchmark index construction. Exhibit 3 shows how the frequency of outperformance by the S&P Style Indices generally increased with the frequency of outperformance by S&P U.S. Core Equity Indices.

We have previously discussed how the S&P Composite 1500® is constructed differently than the Russell 3000. For example, new index additions to the S&P Composite 1500 need to have a history of positive earnings, whereas no such requirement is used by the Russell 3000. This affects index constituent selection and can help explain why the S&P U.S. Core Indices have had significant exposure to the quality factor. During the time periods when quality outperforms, this can lead to a positive selection effect relative to other indices.

One segment where the use of an earnings screen has made a big impact is in small caps. The S&P SmallCap 600 has outperformed the Russell 2000 by about 2% since 1994, based on differences in annualized total returns. Exhibit 4 shows that companies with a track record of positive earnings typically fared better this year: the selection effect accounted for over 80% of the S&P 600’s outperformance against the Russell 2000 in H1 2022. As for the allocation effect, the S&P 600’s underweight to the Health Care sector helped relative performance, whereas its underweight to Utilities detracted from relative returns.

The first half of 2022 was extremely challenging for the U.S. equity market. However, there were some bright spots when comparing S&P DJI’s indices to its competitors. Across the style box, S&P DJI’s indices outperformed their Russell counterparts in nearly every category. In many cases, the relative performance was near the top of the historical range back to 1996. Digging into small caps, we see that the significant outperformance of the S&P SmallCap 600 was largely driven by the selection effect and the earnings screen. Over H1 2022 and the long term, a tilt toward profitable companies and the quality factor has benefitted the S&P SmallCap 600 relative to the Russell 2000.

The posts on this blog are opinions, not advice. Please read our Disclaimers.

The Case for Dividend Aristocrats in Pan Asia

Contributor Image
George Valantasis

Associate Director, Factors and Dividends

S&P Dow Jones Indices

During a time of acute monetary policy tightening throughout much of the western world, major Asian central banks have remained relatively more accommodative. In China, the People’s Bank of China cut its key five-year prime loan rate last week1 after cutting it only a few months ago in May.

In addition to the looser monetary policy, growth forecasts in the region appear to be strong. The International Monetary Fund is forecasting GDP growth in the Asia Pacific region to be 4.9% in 2022 and 5.1% in 2023.2 For market participants interested in this region due to the aforementioned macroeconomic tailwinds, a dividend growth strategy such as the S&P Pan Asia Dividend Aristocrats® may be worth considering.

A Focus on Dividends and Quality

To qualify for the index, companies must have followed a managed dividends policy of increasing dividends for at least seven consecutive years (with a one-year constant dividend growth buffer). Companies must also have positive earnings and a dividend payout ratio between 0% and 100%. To avoid dividend traps, stocks with an indicated annualized dividend (IAD) yield above 10% are excluded from the index. The S&P Dividend Aristocrats methodology provides a ballast for investors since the ability to consistently grow dividends every year through different economic environments can be an indication of financial strength and discipline.

Lastly, companies that pass these filters are ranked by their IAD yield, with the top 100 stocks selected. The weighting caps are 5% for single stocks, 30% for countries and 30% for sectors.

Examining Country Exposure

Exhibit 1 shows the country weights for the S&P Pan Asia Dividend Aristocrats versus the S&P Pan Asia BMI. Compared with the S&P Pan Asia BMI, the S&P Pan Asia Dividend Aristocrats had a substantial overweight to China (particularly Hong Kong) and Australia and a slight underweight to Japan. These three countries accounted for over 93% of the weight in the S&P Pan Asia Dividend Aristocrats.

Yield Advantage

Looking at Exhibit 2, the S&P Pan Asia Dividend Aristocrats has shown considerable yield enhancement over the S&P Pan Asia BMI. Over the full period, the S&P Pan Asia Dividend Aristocrats averaged a 3.32% 12-month trailing dividend yield versus 2.42% for the S&P Pan Asia BMI.

Recently, the yield pick-up has been more pronounced. The difference in yield in 2020 and 2021 was 1.68% and 1.64%, respectively, compared with only 0.9% over the full period.

Fundamental Ratios

Exhibit 3 shows common valuation ratios for the S&P Pan Asia Dividend Aristocrats versus the S&P Pan Asia BMI. The S&P Pan Asia Dividend Aristocrats trades at a substantial discount versus its benchmark, with an average discount across the four metrics of 34%. Importantly, the S&P Pan Asia Dividend Aristocrats trades at a forward one-year price-to-earnings (P/E) ratio of 9.86 and price-to-cash flow (P/CF) ratio of 7.69, equating to a 22% and 50% discount, respectively.

Performance

Exhibit 4 displays the strong full-period performance of the S&P Pan Asia Dividend Aristocrats compared with the S&P Pan Asia BMI. Since December 2001, the S&P Pan Asia Dividend Aristocrats has generated a 9.40% annualized return versus 7.04% for the benchmark, while exhibiting less volatility.

Over a short-term horizon, the S&P Pan Asia Dividend Aristocrats also demonstrated relative outperformance over its benchmark. YTD, the index was down 13.49% versus a decline of 15.70% for the benchmark.

In general, the S&P Pan Asia Dividend Aristocrats generated lower volatility in most time periods measured and registered a nearly 5% improvement in maximum drawdown versus the benchmark.

With its dividend yield enhancement, modest valuation and attractive long-term risk-adjusted returns, the Pan Asia Dividend Aristocrats could provide a potential opportunity for market participants seeking exposure to the Pan Asia region.

1 See https://www.wsj.com/articles/chinese-banks-cut-rates-to-spur-economic-growth-11661151854

2 See https://data.imf.org/?sk=abff6c02-73a8-475c-89cc-ad515033e662

The posts on this blog are opinions, not advice. Please read our Disclaimers.

S&P 500 GARP Index: Growth at a Reasonable Price Anyone?

Contributor Image
Wenli Bill Hao

Director, Factors and Dividends Indices, Product Management and Development

S&P Dow Jones Indices

While growth stocks have the potential to grow at a rate significantly above the market, they have faltered during 2022 on the back of high inflation and rising interest rates. For market participants toying with the idea of when and how to get back in, the S&P 500® GARP (Growth at a Reasonable Price) Index may be worthy of consideration since it tracks companies with consistent sales and earnings growth, reasonable valuation, solid financial strength and strong earning power.

Methodology Overview

The S&P 500 GARP Index first identifies the top 150 stocks from the S&P 500 as ranked by their growth scores. From those 150 stocks, the top 75 are selected based on their Quality & Value (QV) Composite Score. The QV Score is based on the average of two quality factors (financial leverage ratio and return on equity) and one value factor (earnings to price ratio). Hence, these 75 stocks represent growth stocks with relatively higher quality and value characteristics.

These 75 constituents are weighted proportional to their growth exposure, subject to a maximum weight of 5%. This approach seeks to provide purer growth exposure and limit concentration risk. As of the end of July 2022, the index’s top 10 holdings accounted for less than 20% of the total weight, and it had exposure in all 11 sectors.

Short- and Long-Term Outperformance

Over the three-year period ending July 30, 2022, the S&P 500 GARP Index has outperformed its benchmark by 11.10% (see Exhibit 1). Additionally, over the full back-test period, the index has outperformed by an annualized 3.16%.

Historical Performance in High-Inflation Environments

Given the current economic environment, it is particularly interesting to observe that the S&P 500 GARP Index has tended to outperform in periods of high inflation. In Exhibit 2, we compare the performance of the S&P 500 GARP Index and S&P 500 in periods when the year-over-year CPI rate exceeds 3% for at least 12 consecutive months.

During the longest inflation periods (January 2000-June 2001 and September 2004-August 2006), the S&P 500 GARP Index outperformed its benchmark by 25.12% and 17.47%, respectively. In the inflation period from March 2021 to July 2022, the index outperformed the S&P 500 by 1.14%.

Historical Performance in Bear Markets

In addition to periods of inflation, the S&P 500 GARP Index has also historically performed relatively well in bear markets. In comparison with S&P 500, the S&P 500 GARP Index had smaller drawdowns in all but one bear market in early 2020, coinciding with the start of the COVID-19 pandemic (see Exhibit 3). During this unique and short-lived bear market (the broader economy shutdown, work-from-home phenomenon and worldwide desperation for effective vaccines), the mega-cap Information Technology stocks surged, leading to S&P 500 outperformance.

Conclusion

Aiming to capture multi-factor risk premiums, the S&P 500 GARP Index selects growth stocks with relatively high quality at a reasonable price. The strategy has strong historical outperformance over both short- and long-term horizons relative to the S&P 500. Moreover, it has tended to perform relatively better, historically, in long high inflation and long drawdown periods. As such, the S&P 500 GARP Index is uniquely situated as a potential approach for those looking to gain exposure to growth with relatively higher quality and reasonable valuations.

The posts on this blog are opinions, not advice. Please read our Disclaimers.