Get Indexology® Blog updates via email.

In This List

SPIVA and Style

The Case for The S&P 500 GARP Index

SPIVA U.S. Year-End 2020 Scorecard: Passive Continued Its Winning Streak

A Change in Fortune

Celebrating 64 Years of the S&P 500

SPIVA and Style

Contributor Image
Craig Lazzara

Former Managing Director, Index Investment Strategy

S&P Dow Jones Indices

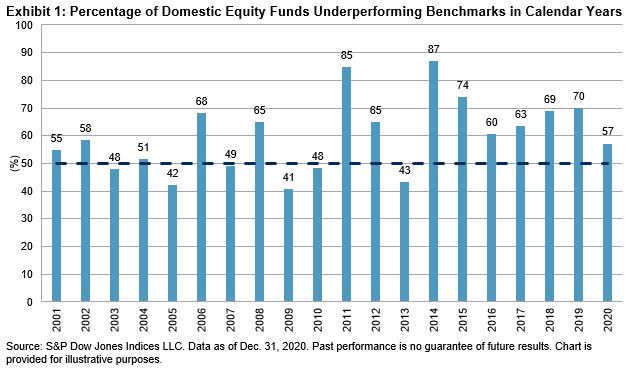
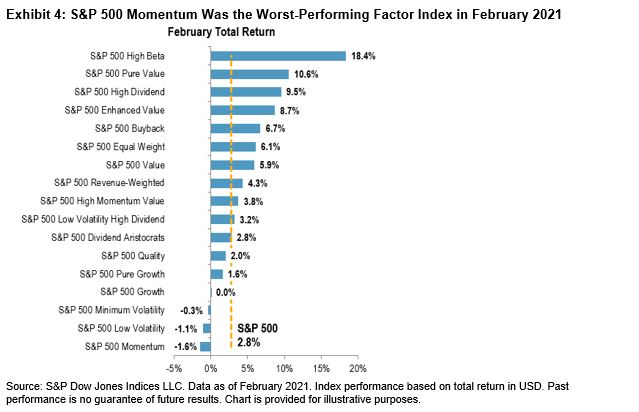
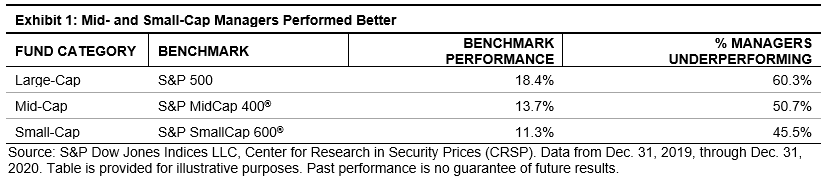
Last week S&P Dow Jones Indices released its SPIVA® U.S. Year-End 2020 Scorecard. As has been the case for 17 of the past 20 calendar years, the majority of active large-cap managers underperformed the S&P 500®. Performance was better for mid- and small-cap managers, as Exhibit 1 shows. What caused the advantage for smaller-capitalization strategies?

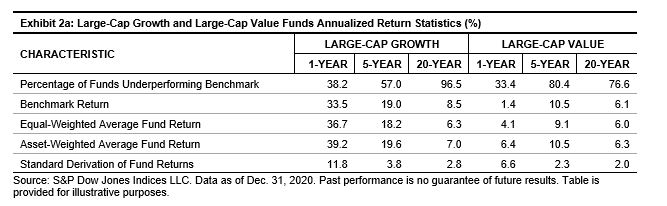
Style bias supplies part of the answer. We refer to “style bias” as any systematic tendency in an actively-managed portfolio. For example, if a portfolio habitually tilts toward growth stocks, we’d refer to this tilt as a growth bias. (This is different from making tactical allocations between growth and value, depending on a manager’s judgment of their relative attractiveness.) One of the most important style biases concerns the size of companies in an active portfolio relative to its benchmark index.

Simple as it seems, style bias has much to say about active management. Exhibit 2 examines quarterly data on the relative performance of the S&P 500 and the S&P MidCap 400. Of 76 quarters between 2002 and 2020, the S&P 400TM outperformed the S&P 500 in 42. In those quarters, a majority of large-cap managers outperformed the S&P 500 15 times for a 36% hit rate. In contrast, in the 34 quarters when the S&P 500 beat the S&P 400, the frequency with which most large-cap managers outperformed fell to 12% (4/34).

We see an analogous effect among mid-cap managers, as shown in Exhibit 3. When the S&P 400 outperformed the S&P 500, the frequency with which most mid-cap managers outperformed was 24% (10/42). When the S&P 500 dominated, however, the likelihood that a majority of mid-cap managers would outperform was 59% (20/34).

Historically, large-cap managers perform better when mid-cap stocks beat large caps, and mid-cap managers perform better when large caps beat mid-caps. These results suggest that the average large-cap manager has a small-cap tilt relative to his benchmark, while the average mid-cap manager has a larger-cap tilt. These inferences, which are quite reasonable, help explain SPIVA’s 2020 results. Smaller-cap managers could add value by moving up the capitalization scale. No such reprieve was available to large-cap managers last year.

The posts on this blog are opinions, not advice. Please read our Disclaimers.

The Case for The S&P 500 GARP Index

Contributor Image
Wenli Bill Hao

Director, Factors and Dividends Indices, Product Management and Development

S&P Dow Jones Indices

The S&P 500® GARP (Growth at a Reasonable Price) Index just had its second anniversary since its launch in February 2019. During the latter half of this time, the world experienced the worst global pandemic in a century. Equities entered a swift V-shaped bear market and rebound.

In this blog, we review the index’s performance, characteristics, and relevant single-factor strategies.

Performance

During the past one-year period, the S&P 500 GARP Index outperformed the S&P 500 and other selected single-factor indices by a wide margin. For the overall post-launch two-year period, the S&P 500 GARP Index again outperformed the S&P 500 and other selected single-factor indices, with the exception of the S&P 500 Pure Growth.

Rebasing the S&P 500 GARP Index, its associated single factor indices, and the S&P 500 to 100 on Feb. 28, 2019, the S&P 500 GARP Index, S&P 500 Quality Index, S&P 500 Enhanced Value Index, and S&P 500 Pure Growth reached 142.3, 141.9, 115.5, and 148.1, respectively, on Feb. 26, 2021, while the S&P 500 reached 142.0 (see Exhibit 1).

The outperformance of the S&P 500 GARP Index mainly came from the most recent 12-month period. During this time, the S&P 500 GARP Index outperformed the S&P 500 and selected single-factor indices, as shown in Exhibit 2.

Such results are not surprising given recent market development. First, with the vaccination rollout and decrease in new COVID-19 cases, investors expect real economic recovery on the horizon. Second, as yields of longer-term U.S. government bonds tick up, investors may start to rotate out of expensive growth stocks and favor value companies.

Strategy Characteristics

The S&P 500 GARP Index is designed to track growth companies with relatively high quality and good valuation. It aims to balance pure growth and pure valuation exposures, as the former tends to target high-growth, yet expensive stocks, while the latter may take a longer time to pay off.1

To achieve its goal, the S&P 500 GARP Index selects stocks using two layers of filters:2 a growth style and a composite style of quality and value (QV). Stocks are first ranked by growth z-scores, with the top 150 stocks remaining eligible for index inclusion. Then, these stocks are ranked by QV composite z-score. The top 75 stocks are selected and form the index. The factors used in the index design are shown in Exhibit 3.

Factor Exposure

Using the risk factors from a commercial risk model, we present the active exposures3 of four factors. The definitions of the four factors are in line with those used in the S&P 500 GARP Index. In comparison with the S&P 500, the GARP strategy has higher exposures to earnings, sales growth, earnings yield, and profitability,4 and lower exposures to leverage (see Exhibit 4). The factor exposure results align with the objective of the index design.

Conclusion

Aiming to balance pure growth and pure valuation exposures, the S&P 500 GARP Index selects growth stocks with relatively high quality at a reasonable price. Factor exposure analysis shows that the index’s multi-factor sequential filtering approach achieves its design objective. Moreover, during the post-launch period, the GARP strategy had better returns than the S&P 500 and other relevant single-factor indices, except the S&P 500 Pure Growth. The current market environment may present an opportunity for investors to consider the S&P 500 GARP Index as they diversify away from expensive pure growth stocks.

1 Refer to Indexing GARP Strategies: A Practitioner’s Guide for strategy rationale, designs, and attribution analysis.

2 See the S&P 500 GARP Index Methodology for more information.

3 Active factor exposure is defined as the strategy factor exposure minus the benchmark factor exposure.

4 Refer to Axioma United States Equity Factor Risk Models for more information about factor definitions.

The posts on this blog are opinions, not advice. Please read our Disclaimers.

SPIVA U.S. Year-End 2020 Scorecard: Passive Continued Its Winning Streak

Contributor Image
Berlinda Liu

Former Director, Multi-Asset Indices

S&P Dow Jones Indices

In a year that brought a pandemic, volatility, and policy stimulus, asset prices rose nearly across the board. However, positive absolute returns did not necessarily translate into success for active managers relative to their benchmarks. According to the SPIVA® U.S. Year-End 2020 Scorecard, most active fund managers in the U.S. underperformed their benchmarks over the past year. Among actively managed domestic equity funds, 57% lagged the S&P Composite 1500® in 2020, marking the seventh consecutive year in which a majority of U.S. active equity managers underperformed.

For the 11th consecutive one-year period, the majority (60%) of large-cap funds underperformed the S&P 500®. Mid-cap (51%) and small-cap (46%) funds did somewhat better relative to the S&P MidCap 400® and S&P SmallCap 600®, respectively. As we observed in our 2020 mid-year report, the performance divergence among different categories diminished as the time horizon lengthened. Over the past 20 years, more than 88% of U.S. equity funds failed to beat their benchmarks across all three market capitalization segments.

Growth funds dominated their value peers in 2020. As shown in Exhibit 2a and 2b, the equally weighted average return of all large-cap growth managers was 36.7%, approximately nine times the equally weighted average return generated by all large-cap value managers. However, the advantage of growth funds narrowed over time; there was little difference across the 20-year horizon. More importantly, longer term results showed little difference in funds’ performance relative to their benchmarks. Most funds in both categories underperformed in all periods longer than five years.

The data from the SPIVA U.S. Year-End 2020 Scorecard show a continued winning streak for passive investment. Even the few short-term active bright spots tended to lag their benchmarks over the long term. Across all capitalizations and investment styles, the most probable path for short-term outperformance is to fall short of benchmark returns eventually.

The posts on this blog are opinions, not advice. Please read our Disclaimers.

A Change in Fortune

Contributor Image
Anu Ganti

U.S. Head of Index Investment Strategy

S&P Dow Jones Indices

Three months ago, we observed that times of severe underperformance for Equal Weight can bode well for future performance. This reflection had become reality by the end of February. After almost four years of underperformance, the S&P 500® Equal Weight Index outperformed the S&P 500 by 1.6% over the past 12 months, as we see in Exhibit 1. This result may be the beginning of a trend in mean-reversion that we observe from the exhibit’s historical peaks and troughs.

The turning of the tide for Equal Weight was primarily driven by strength in smaller caps, as Equal Weight has a small-cap bias. Exhibit 2 shows the strong outperformance of the S&P MidCap 400® and S&P SmallCap 600® relative to their large-cap counterpart.

The impact of smaller-cap outperformance at a sector level is noticeable from Exhibit 3’s 12-month attribution of the S&P 500 Equal Weight Index versus the S&P 500. Equal weighting within Financials and Industrials was a key contributor to the recovery in Equal Weight. 

In addition, Equal Weight has a natural anti-momentum bias, as by definition the strategy sells relative winners and purchases relative losers at each rebalance. Exhibit 4 illustrates that the S&P 500 Momentum was the worst performing factor in February, furthering Equal Weight’s positive trajectory.

The comeback of smaller-caps and Equal Weight might have positive implications for active managers, as their portfolios tend to be closer to equal than cap weighted. Exhibit 5 plots the underperformance of large-cap funds compared to the relative performance of the S&P 400TM versus the S&P 500, as a proxy measure for smaller-cap outperformance. We notice that the three years when most active managers outperformed (2005, 2007, and 2009) all coincided with smaller-cap outperformance.

Finally, we’ve written previously about how the current environment compares to the tech bubble of the late 1990s. Concentration levels in the cap-weighted S&P 500 exceed those of 1999; an equal weight alternative could potentially offer above-average diversification benefits.

The posts on this blog are opinions, not advice. Please read our Disclaimers.

Celebrating 64 Years of the S&P 500

Contributor Image
Hamish Preston

Head of U.S. Equities

S&P Dow Jones Indices

The S&P 500® was launched on March 4, 1957, and so yesterday marked its 64th birthday. To celebrate this milestone, a number of my colleagues and I recently appeared on our Index Investment Strategy team’s weekly call (sign up for the daily dashboard to receive the invite). If you couldn’t make it, here are a few highlights.

Exhibit 1 shows the S&P 500’s closing price levels over its live history. Eleven bear markets captured periods of pessimism, while the intervening recoveries reflected improved outlooks. Overall, the index posted an annualized price return of around 7.2% over the last 64 years.

Representing the Large-Cap U.S. Equity Market

The S&P 500 represents the large-cap segment of the U.S. equity market. The index is float-market-cap weighted, which means that index weights reflect aggregate investor expectations. Exhibit 2 shows how the evolution of the largest five companies in the S&P 500 and its GICS® sector weights captured the increased importance of Information Technology companies, and the reduction in Industrials and Energy companies.

Not Just One Index – Ecosystems Matter!

A sizeable ecosystem has grown up around the S&P 500.  Exhibit 3 shows a range of indices based on the S&P 500. This is important because the liquidity associated with products tracking these indices can help foster transparency, market efficiency, and investor confidence.

Beating the S&P 500 Has Been Difficult

Over its history, it’s proven to be very difficult for active managers to beat the S&P 500. Our U.S. SPIVA Scorecards show that most U.S. large-cap active managers underperformed the S&P 500 in 16 of 19 calendar years between 2001 and 2019. And as of the end of June 2020, the majority of all large-cap U.S. equity managers underperformed the S&P 500 across all time horizons shown.

Although such underperformance is not specific to the U.S., and there are various explanations as to why beating benchmarks is difficult, increased awareness of the potential benefits of adopting an indexed-based approach has arguably had a bigger impact in U.S. large caps than in most other areas. Exhibit 4 shows that assets directly tracking the S&P 500 have grown substantially since 1996, reaching USD 4.59 trillion at the end of 2019. Multiplying the assets tracking the S&P 500 at the end of the year by the corresponding difference in average expense ratio between active funds and their passive alternatives shows that the estimated cumulative savings to investors from passively tracking the S&P 500 was USD 300 billion between 1996 and 2019.

The S&P 500’s construction, its historical performance, its large ecosystem, and its challenge to active managers all help to explain the index’s relevance and appeal. Here’s to another 64 years!

The posts on this blog are opinions, not advice. Please read our Disclaimers.