Get Indexology® Blog updates via email.

In This List

SPIVA U.S. Year-End 2020 Scorecard: Passive Continued Its Winning Streak

A Change in Fortune

Celebrating 64 Years of the S&P 500

Special Purpose Acquisition Companies (SPACs) – Part I

How to Value Thematic Strategies

SPIVA U.S. Year-End 2020 Scorecard: Passive Continued Its Winning Streak

Contributor Image
Berlinda Liu

Former Director, Multi-Asset Indices

S&P Dow Jones Indices

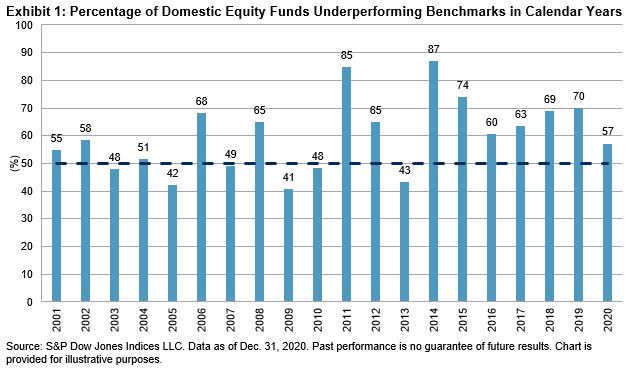
In a year that brought a pandemic, volatility, and policy stimulus, asset prices rose nearly across the board. However, positive absolute returns did not necessarily translate into success for active managers relative to their benchmarks. According to the SPIVA® U.S. Year-End 2020 Scorecard, most active fund managers in the U.S. underperformed their benchmarks over the past year. Among actively managed domestic equity funds, 57% lagged the S&P Composite 1500® in 2020, marking the seventh consecutive year in which a majority of U.S. active equity managers underperformed.

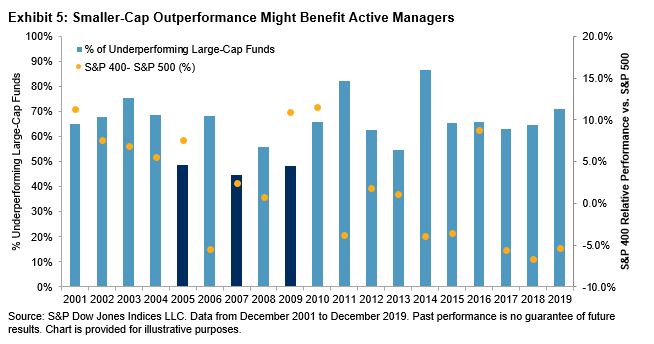
For the 11th consecutive one-year period, the majority (60%) of large-cap funds underperformed the S&P 500®. Mid-cap (51%) and small-cap (46%) funds did somewhat better relative to the S&P MidCap 400® and S&P SmallCap 600®, respectively. As we observed in our 2020 mid-year report, the performance divergence among different categories diminished as the time horizon lengthened. Over the past 20 years, more than 88% of U.S. equity funds failed to beat their benchmarks across all three market capitalization segments.

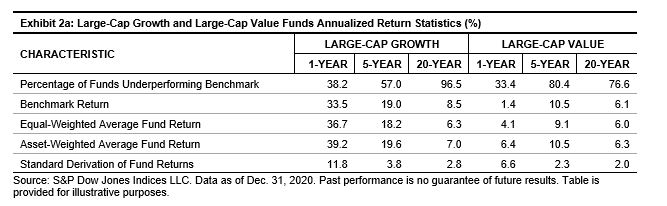
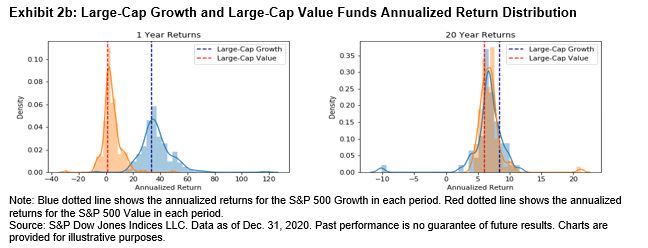
Growth funds dominated their value peers in 2020. As shown in Exhibit 2a and 2b, the equally weighted average return of all large-cap growth managers was 36.7%, approximately nine times the equally weighted average return generated by all large-cap value managers. However, the advantage of growth funds narrowed over time; there was little difference across the 20-year horizon. More importantly, longer term results showed little difference in funds’ performance relative to their benchmarks. Most funds in both categories underperformed in all periods longer than five years.

The data from the SPIVA U.S. Year-End 2020 Scorecard show a continued winning streak for passive investment. Even the few short-term active bright spots tended to lag their benchmarks over the long term. Across all capitalizations and investment styles, the most probable path for short-term outperformance is to fall short of benchmark returns eventually.

The posts on this blog are opinions, not advice. Please read our Disclaimers.

A Change in Fortune

Contributor Image
Anu Ganti

U.S. Head of Index Investment Strategy

S&P Dow Jones Indices

Three months ago, we observed that times of severe underperformance for Equal Weight can bode well for future performance. This reflection had become reality by the end of February. After almost four years of underperformance, the S&P 500® Equal Weight Index outperformed the S&P 500 by 1.6% over the past 12 months, as we see in Exhibit 1. This result may be the beginning of a trend in mean-reversion that we observe from the exhibit’s historical peaks and troughs.

The turning of the tide for Equal Weight was primarily driven by strength in smaller caps, as Equal Weight has a small-cap bias. Exhibit 2 shows the strong outperformance of the S&P MidCap 400® and S&P SmallCap 600® relative to their large-cap counterpart.

The impact of smaller-cap outperformance at a sector level is noticeable from Exhibit 3’s 12-month attribution of the S&P 500 Equal Weight Index versus the S&P 500. Equal weighting within Financials and Industrials was a key contributor to the recovery in Equal Weight. 

In addition, Equal Weight has a natural anti-momentum bias, as by definition the strategy sells relative winners and purchases relative losers at each rebalance. Exhibit 4 illustrates that the S&P 500 Momentum was the worst performing factor in February, furthering Equal Weight’s positive trajectory.

The comeback of smaller-caps and Equal Weight might have positive implications for active managers, as their portfolios tend to be closer to equal than cap weighted. Exhibit 5 plots the underperformance of large-cap funds compared to the relative performance of the S&P 400TM versus the S&P 500, as a proxy measure for smaller-cap outperformance. We notice that the three years when most active managers outperformed (2005, 2007, and 2009) all coincided with smaller-cap outperformance.

Finally, we’ve written previously about how the current environment compares to the tech bubble of the late 1990s. Concentration levels in the cap-weighted S&P 500 exceed those of 1999; an equal weight alternative could potentially offer above-average diversification benefits.

The posts on this blog are opinions, not advice. Please read our Disclaimers.

Celebrating 64 Years of the S&P 500

Contributor Image
Hamish Preston

Head of U.S. Equities

S&P Dow Jones Indices

The S&P 500® was launched on March 4, 1957, and so yesterday marked its 64th birthday. To celebrate this milestone, a number of my colleagues and I recently appeared on our Index Investment Strategy team’s weekly call (sign up for the daily dashboard to receive the invite). If you couldn’t make it, here are a few highlights.

Exhibit 1 shows the S&P 500’s closing price levels over its live history. Eleven bear markets captured periods of pessimism, while the intervening recoveries reflected improved outlooks. Overall, the index posted an annualized price return of around 7.2% over the last 64 years.

Representing the Large-Cap U.S. Equity Market

The S&P 500 represents the large-cap segment of the U.S. equity market. The index is float-market-cap weighted, which means that index weights reflect aggregate investor expectations. Exhibit 2 shows how the evolution of the largest five companies in the S&P 500 and its GICS® sector weights captured the increased importance of Information Technology companies, and the reduction in Industrials and Energy companies.

Not Just One Index – Ecosystems Matter!

A sizeable ecosystem has grown up around the S&P 500.  Exhibit 3 shows a range of indices based on the S&P 500. This is important because the liquidity associated with products tracking these indices can help foster transparency, market efficiency, and investor confidence.

Beating the S&P 500 Has Been Difficult

Over its history, it’s proven to be very difficult for active managers to beat the S&P 500. Our U.S. SPIVA Scorecards show that most U.S. large-cap active managers underperformed the S&P 500 in 16 of 19 calendar years between 2001 and 2019. And as of the end of June 2020, the majority of all large-cap U.S. equity managers underperformed the S&P 500 across all time horizons shown.

Although such underperformance is not specific to the U.S., and there are various explanations as to why beating benchmarks is difficult, increased awareness of the potential benefits of adopting an indexed-based approach has arguably had a bigger impact in U.S. large caps than in most other areas. Exhibit 4 shows that assets directly tracking the S&P 500 have grown substantially since 1996, reaching USD 4.59 trillion at the end of 2019. Multiplying the assets tracking the S&P 500 at the end of the year by the corresponding difference in average expense ratio between active funds and their passive alternatives shows that the estimated cumulative savings to investors from passively tracking the S&P 500 was USD 300 billion between 1996 and 2019.

The S&P 500’s construction, its historical performance, its large ecosystem, and its challenge to active managers all help to explain the index’s relevance and appeal. Here’s to another 64 years!

The posts on this blog are opinions, not advice. Please read our Disclaimers.

Special Purpose Acquisition Companies (SPACs) – Part I

Contributor Image
Jason Ye

Director, Factors and Thematics Indices

S&P Dow Jones Indices

SPACs have been raising funds faster than ever before. In 2020, SPACs raised close to USD 100 billion in public offerings, which is more than in the prior 10 years combined (see Exhibit 1); the average IPO size also doubled from 2019 (see Exhibit 2). On July 22, 2020, Bill Ackman’s Pershing Square Capital Management raised USD 4 billion in the IPO of Pershing Square Tontine Holdings Ltd., recording the largest SPAC IPO to date.

Given this uptick in interest, we are going to publish a series of three blogs on SPACs investing. In this first blog, we will introduce the concept of SPACs and discuss market trends. Then, we will discuss a SPAC’s lifecycle and the potential benefits and risks of investing in SPACs. In the last blog, we will analyze SPACs’ liquidity and performance characteristics.

What Is a SPAC?

A SPAC is created specifically to pool funds in order to finance an acquisition opportunity within a set timeframe.1 The SEC’s Electronic Data Gathering, Analysis, and Retrieval database for public companies assigns SPACs a standard industrial code of 6770, classifying it as a subgroup of blank check companies.

Before 2005, SPACs were traded in the over-the-counter (OTC) market. In 2005, the AMEX (now NYSE MKT LLC) started to list SPACs. In 2008, both NASDAQ and NYSE started to list SPACs. Currently, NASDAQ is the primary listing venue for SPACs (see Exhibit 3).

SPACs are not exclusive to U.S.-based exchanges. Some countries such as Canada, Italy, and South Korea allow SPAC listings in local exchanges as well. Currently, both Hong Kong and London are considering allowing SPAC listings.2 However, the overseas SPACs IPO markets were quieter in 2020 compared to the ones in the U.S. (see Exhibit 4); Canada was the most active SPAC market outside of the U.S by number of SPAC IPOs. Although the historical number of SPAC IPOs outside the U.S. was slightly greater than the number in the U.S., investors in the U.S. raised over 15 times more capital in SPAC IPOs than non-U.S.-based investors (see Exhibit 5).

1 https://www.sec.gov/fast-answers/answers-blankcheckhtm.html

2 https://www.reuters.com/article/hong-kong-spac/hong-kong-considering-allowing-spac-listings-idUSL2N2L009P; https://www.ft.com/content/2079bd8e-79b7-4820-9be8-c20020f48aee

The posts on this blog are opinions, not advice. Please read our Disclaimers.

How to Value Thematic Strategies

Contributor Image
Matthew Bartolini

Managing Director

State Street Global Advisors

During the pandemic, we’ve seen an evolution of behavioral changes fuel transcendent trends across our economy that may create new future growth opportunities.

This has spurred investor interest in thematic ETFs that seek to provide exposure to firms at the forefront of innovation. In 2020, more than $40 billion flowed into ETFs focused on Future Communication, Clean Energy, Smart Transportation, and Cloud Computing.1

To formulate a fundamental view on these areas of innovation, it is important to consider which valuation metric may be the most appropriate.

Fundamentally thematic

Selecting the most appropriate metric requires understanding the type of firms typically found in the 145 funds we identify as thematic strategies. Our security look-through analysis finds many of these funds are concentrated in the Consumer Discretionary, Health Care, and Information Technology sectors. Importantly, the firms in those sectors typically have significant intangible assets2 on their balance sheets. Price-to-book may not be the best metric here because high intangible assets usually understate a firm’s book value—potentially inflating the firm’s price-to-book measure.

Earnings-related issues for thematics

There is an issue, however, if we use earnings-related metrics (e.g. price-to-earnings (P/E), price-to-next-12-month-earnings, and enterprise value-to-EBITDA). First, negative earnings firms must be removed, resulting in an incomplete exposure being analyzed. And those firms must be removed so as not skew the result (i.e., negative P/E values would tamp down the high P/E values when performing an average calculation for a portfolio).

The presence of negative earnings firms in some thematic exposures means any multiple that has earnings-related information in the denominator should not be utilized. This also holds true for the price-to-earnings-growth ratio (PEG), since it still relies on earnings in the denominator, while normalizing the ratio by expected growth.

No earnings, but revenue, hopefully

While some innovative firms do not have earnings, they likely have sales/revenue. Therefore, using one of these two sales-based metrics may be more optimal: price-to-sales and enterprise value-to-sales. The latter, in my opinion, offers the most appropriate and comprehensive view of a firm’s operations, as enterprise value (EV) accounts for both the firm’s equity value and amount of debt.3 Accounting for the level of leverage/debt utilized by the firm to generate revenue, it tends to be more comparable across industries, given it is capital structure agnostic (i.e., high-debt industries typically look cheaper on a price-to-xyz basis since their debt isn’t captured in the metric, but under EV, the debt is taken into account).

A list of metrics — and the strengths and drawbacks of thematic valuations — are shown below:

The table below compares the different metrics for an aggregated portfolio of all 18 Broad Innovation funds4 with the broad S&P 500. The average figure for the Broad Innovation category is higher than the broad market — as would be expected. However, when it comes to enterprise value-to-sales, the skew is much tighter, due to dynamics discussed above.

While these exposures were trading rich at the end of last year, the multiples are elevated to the broader market due to higher expected growth estimates and the potential for behavioral changes to create future growth opportunities.

Analysis in 2021 and beyond

The pandemic will continue to spark greater need for innovative technologies that allow for more contactless interactions, advanced medicine, digital connectivity, and intelligent infrastructure.

With more ways to participate in these thematic trends, investors need a classification framework as the first step in due diligence.  It’s also important to understand the construction approaches for each exposure. Of all the valuation multiples available, enterprise value-to-sales may be the most appropriate.


1 Bloomberg Finance L.P. as of December 31, 2020 based on SPDR Americas Research calculations.

2 An intangible asset is an asset that is not physical in nature. Goodwill, brand recognition and intellectual property, such as patents, trademarks, and copyrights, are all intangible assets. Intangible assets exist in opposition to tangible assets, which include land, vehicles, equipment, and inventory.

3 EV is the market capitalization of a company as well as short-term and long-term debt less any cash on the company’s balance sheet.

4 Eighteen funds, as classified by SPDR Americas Research as of December 15, 2020.


Glossary

S&P 500® Index: A popular benchmark for U.S. large-cap equities that includes 500 companies from leading industries and captures approximately 80% coverage of available market capitalization.

S&P 500® Growth Index: A market-capitalization-weighted index developed by Standard and Poor’s consisting of those stocks within the S&P 500 Index that exhibit strong growth characteristics.

Disclosures

The views expressed in this material are the views of Matthew Barotlini through the period ended February 12, 2021 and are subject to change based on market and other conditions. This document contains certain statements that may be deemed forward looking statements. Please note that any such statements are not guarantees of any future performance and actual results or developments may differ materially from those projected. Investing involves risk including the risk of loss of principal. Past performance is no guarantee of future results.

The information provided does not constitute investment advice and it should not be relied on as such. It should not be considered a solicitation to buy or an offer to sell a security. It does not take into account any investor’s particular investment objectives, strategies, tax status or investment horizon. You should consult your tax and financial advisor. All material has been obtained from sources believed to be reliable. There is no representation or warranty as to the accuracy of the information and State Street shall have no liability for decisions based on such information.

The whole or any part of this work may not be reproduced, copied or transmitted or any of its contents disclosed to third parties without State Street Global Advisors’ express written consent.

The trademarks and service marks referenced herein are the property of their respective owners. Third party data providers make no warranties or representations of any kind relating to the accuracy, completeness or timeliness of the data and have no liability for damages of any kind relating to the use of such data.

Investing involves risk including the risk of loss of principal.

ETFs trade like stocks, are subject to investment risk, fluctuate in market value and may trade at prices above or below the ETFs net asset value. Brokerage commissions and ETF expenses will reduce returns.

Standard & Poor’s®, S&P® and SPDR® are registered trademarks of Standard & Poor’s Financial Services LLC (S&P); Dow Jones is a registered trademark of Dow Jones Trademark Holdings LLC (Dow Jones); and these trademarks have been licensed for use by S&P Dow Jones Indices LLC (SPDJI) and sublicensed for certain purposes by State Street Corporation. State Street Corporation’s financial products are not sponsored, endorsed, sold or promoted by SPDJI, Dow Jones, S&P, their respective affiliates and third party licensors and none of such parties make any representation regarding the advisability of investing in such product(s) nor do they have any liability in relation thereto, including for any errors, omissions, or interruptions of any index.

State Street Global Advisors, One Iron Street, Boston, MA 02210.

© 2021 State Street Corporation. All rights reserved.

3373882.2.1.AM.RTL | EXP. 2/28/2022

The posts on this blog are opinions, not advice. Please read our Disclaimers.