Get Indexology® Blog updates via email.

In This List

Not a Coincidence

Assessing Gold’s Ascent

Is the S&P 500 Doing Its Job?

Did Australian Active Funds Outperform Benchmarks amid the COVID-19 Pandemic?

The Unmatched Value of a Consistent Approach to Global Benchmarking

Not a Coincidence

Contributor Image
Craig Lazzara

Former Managing Director, Index Investment Strategy

S&P Dow Jones Indices

We recently issued our mid-year SPIVA® reports for the U.S., Australia, and Europe, and other regions will follow in due course. Although one can sometimes find exceptions in the short run, the long-term results of SPIVA can be easily summarized:

  • The majority of active managers underperform most of the time.
  • Historical success does not predict future success.

SPIVA continues a line of inquiry that began nearly 90 years ago with the first study of active fund performance versus passive benchmarks. This work accelerated in the 1970s, as the growth of professional portfolio management drew increasing academic interest. Nobel laureate Paul Samuelson was representative of his contemporaries in suggesting that “most portfolio decision makers should go out of business.”

Active managers didn’t take kindly to Samuelson’s suggestion in 1974 and, despite the accumulation of confirming evidence since then, they don’t take kindly to it today either. We’ve estimated that the cumulative cost savings to asset owners just from indexing the S&P 500®, S&P MidCap 400®, and S&P SmallCap 600® amount to better than $300 billion, and every dollar of costs saved by the investor is a dollar of fees not paid to an active manager. So while resentment is to be expected, it’s surprising that critics of SPIVA sometimes focus on its minutiae, rather than on its results.

The most important thing to realize about SPIVA results is that they are not a coincidence. The active management community didn’t lose a cosmic coin flip 90 years ago; active underperformance happens for a set of readily identifiable reasons. These include:

Professionalization. Portfolio management is a zero-sum game; the only source of alpha for the winners is the negative alpha of the losers. When most of the assets in a market are professionally managed, the average professional won’t beat the market because the average professional is the market. It’s not a coincidence that the first index funds were launched in the 1970s; by that point the U.S. equity market had been largely professionalized.

Cost. The expense ratio of the average actively-managed equity mutual fund was 0.74% in 2019; the average index fund cost 0.07%. The average active manager therefore starts out 67 bps in the hole.

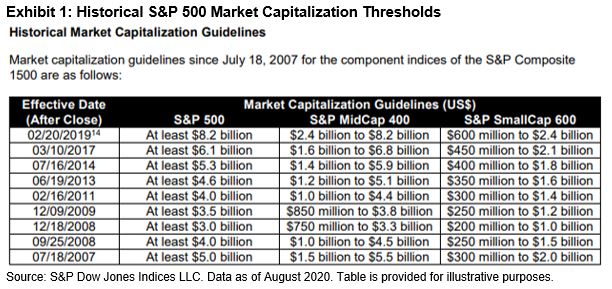
Skewness. The distribution of stock returns is skewed—i.e., most stocks underperform the market average. Exhibit 1 illustrates this for the S&P 500.

Of the 1,010 stocks that were part of the S&P 500 between 2000 and 2019, only 267 returned more than average. The probability that a randomly chosen stock would deliver above-average performance, in other words, was 26%, not 50%. When fewer stocks outperform, active management is harder.

These (and other!) reasons are robust and sustainable. Investment management will stay professionalized, active costs will always exceed index costs, and in most years most stocks underperform the average in most markets. The index advantage is likely to persist.

The posts on this blog are opinions, not advice. Please read our Disclaimers.

Assessing Gold’s Ascent

What’s driving demand for gold this year? S&P DJI’s Jim Wiederhold and CME Group’s Blu Putnam explore what’s pushing gold prices up and how investors are putting the precious metal to work in portfolios.

The posts on this blog are opinions, not advice. Please read our Disclaimers.

Is the S&P 500 Doing Its Job?

Contributor Image
Raymond McConville

Former Communications, Americas

S&P Dow Jones Indices

On Sept. 4, 2020, S&P DJI’s U.S. Index Committee announced that Etsy, Teradyne, and Catalent were being added to the S&P 500®, replacing H&R Block, Coty, and Kohl’s.

The changes attracted significant market attention and sparked a discussion around the names being added to the index, as well as those that were not. These updates also coincided with the S&P 500’s scheduled quarterly rebalancing. Changes to the index can be made at any time—they do not have to happen during quarterly rebalances. However, given the higher-than-usual attention, it’s worth revisiting the S&P 500’s purpose and objective, what the Index Committee does, and how the committee helps ensure that the index is doing its job.

What Is the S&P 500’s Objective?

The S&P 500 is synonymous with U.S. equity market performance and is referenced by investors, analysts, and the media every day. The index was up 1.5% today? Great, the S&P 500 is doing well! Did the market decline? Uh-oh, the S&P 500 did poorly. But whether the index is “doing a good job” has little to do with the direction of its returns.

Per the S&P U.S. Indices Methodology, the objective of the S&P 500 is to “measure the performance of the large-cap segment of the U.S. market.” That’s it. The job of the Index Committee is not to add stocks that it thinks will perform well. Instead, it makes sure the index continues to provide a representative reflection of the large cap U.S. equity market.

Rebalancing versus Reconstituting

The U.S. large-cap market has changed significantly over the years and there are several ways the Index Committee ensures that the 63-year-old S&P 500 reflects that evolution. One of them is by rebalancing the index.

During a rebalance, S&P 500 constituents’ individual weights are adjusted to reflect their latest share counts and float. Company share counts are constantly changing as they issue stock and perform buybacks, so the S&P 500 is rebalanced every quarter to adjust each company’s weighting based on its latest share count and float.
While the Index Committee can also reconstitute the index during a rebalance by adding or removing companies, these changes to index membership can be made at any time—they don’t have to happen during a rebalance and a rebalance doesn’t have to include a reconstitution.

Since the beginning of 2017, 82 companies have been added to the S&P 500.

So, Is the S&P 500 Doing Its Job?

This brings us back to our first question. Have all the changes made over the years by the Index Committee helped the index accurately represent the U.S. large-cap market?

One way we can grade the S&P 500’s performance is through sector representation. Since the index has a fixed count of 500 companies, not every eligible company can be added to the index. One of the factors the Index Committee looks at when considering changes to the index is sector composition. Per the index methodology, this is measured by a comparison of GICS® sector weights in the S&P 500 with the corresponding weights in the large-cap range of the S&P Total Market Index (TMI), which measures the performance of all U.S. stocks.

Using the historical market capitalization thresholds from Appendix A of the S&P U.S. Indices Methodology document, we can arrive at the GICS sector weights for the large-cap section of the S&P TMI.

Exhibit 2 shows the relative sector weights of the S&P 500 against the large-cap portion of the S&P TMI. The average difference is based on year-end weights between 2007 and 2020.Clearly, the S&P 500 GICS sector weights have typically been similar to the large-cap portion of the S&P TMI. And while some differences have emerged in 2020, the S&P 500 remains representative of the large-cap U.S. equity space. The index is doing its job.

The posts on this blog are opinions, not advice. Please read our Disclaimers.

Did Australian Active Funds Outperform Benchmarks amid the COVID-19 Pandemic?

Contributor Image
Priscilla Luk

Managing Director, Global Research & Design, APAC

S&P Dow Jones Indices

With the COVID-19 pandemic, equity markets around the world experienced massive declines with heightened volatility, and the Australian equity market was not immune. Various equity market segments experienced rapid market sell-offs followed by slow recoveries in H1 2020, with the S&P/ASX 200, S&P/ASX Mid-Small, and S&P/ASX 200 A-REIT decreasing 10.4%, 6.9%, and 21.3%, respectively.

Due to the volatile environment, stock return dispersion in global equity indices rocketed to historic highs in March,1 providing fertile ground for stock picking. Return spreads across the S&P/ASX 200 Sector Indices and S&P/ASX 200 Factor Indices were widened to 45.5% and 26.8% in H1 2020, respectively (see Exhibit 1). This market condition may prompt fund investors to question: did Australian active funds outperform benchmarks amid the COVID-19 pandemic?

The answer does not seem favorable for Australian active managers according to their fund performance versus the benchmark in H1 2020. In the recently published SPIVA® Australia Mid-Year 2020 Scorecard, we observed the majority of active funds had worse performance than their respective benchmark indices across most fund categories in H1 2020. Of funds in the Australian Equity General, Australia Equity Mid- and Small-Cap, and International Equity General categories, 64%, 56%, and 60% underperformed their benchmarks, respectively. The portion of underperforming funds was smallest in the Australian Equity A-REIT category, with 45% of funds underperforming the S&P/ASX 200 A-REIT. Australian Bonds was the only category that recorded a positive average return in H1 2020, though more than 70% of funds in this category failed to outperform the S&P/ASX Australian Fixed Interest 0+ Index.

All fund categories underperformed their respective benchmarks over the same period in terms of their equal- and asset-weighted returns. Despite mid- and small-cap funds delivering better average returns than the benchmark over longer time horizons, they recorded a larger average drawdown than the S&P/ASX Mid-Small in H1 2020. The asset-weighted returns exceeded the equal-weighted returns for the Australian Equity General and Australian Equity Mid- and Small-Cap fund categories, indicating larger equity funds tended to suffer less drawdowns during the COVID-19 crisis in these two categories.

During this volatile period, some active managers harvested the benefit of high stock return dispersion, but some were badly hurt. Equity fund return spreads were high in H1 2020, as most obviously seen among the Australian Mid- and Small-Cap funds and International Equity General funds, with the first and third quartile return breakpoints differing by 8.0 % and 8.4%, respectively. One-quarter of Australian Mid-Small-Cap funds outperformed the S&P/ASX Mid-Small by more than 2.5%, but one-quarter underperformed the benchmark by more than 5.5%. Among International Equity General funds, one-quarter delivered excess returns of more than 2.9%, though one-quarter of these funds lost more than 8.7%, which was more than double the benchmark’s drawdown (3.2%).

In our semiannual SPIVA Australia Scorecard, we have consistently observed underperformance for the majority of Australian active funds across most categories over time. The high market volatility seen during the COVID-19 crisis was an excellent time for active fund managers to reveal their portfolio skills, as record-high stock return dispersion resulted in a good opportunity for stock pickers to outperform. However, the results of the mid-year 2020 scorecard revealed that the majority of active fund managers failed to capture this opportunity.

1 For tables and charts on equity index dispersions in March 2020, see the Dispersion Dashboard: https://www.spglobal.com/spdji/en/documents/commentary/dashboard-dispersion-2020-03.pdf


The posts on this blog are opinions, not advice. Please read our Disclaimers.

The Unmatched Value of a Consistent Approach to Global Benchmarking

Contributor Image
John Welling

Director, Global Equity Indices

S&P Dow Jones Indices

Before making its permanent home at S&P DJI in 2004, the S&P Global BMI Series was introduced 15 years prior by Salomon Brothers in 1989. Although MSCI EAFE has the honor of being the first international equity index, the S&P Global BMI lays claim to a number of important firsts in the global indexing industry—the most important of these being that it was the first to incorporate float adjustment into the index methodology and to include large-, mid-, and small-cap constituents in a single, modular index series. In this regard, the S&P Global BMI set many of the key standards for modern global benchmark construction, as both MSCI and FTSE followed many years later in incorporating these core benchmark principles into their own index series (see Exhibit 1).

In our first blog in a series highlighting key features of the global equities benchmark landscape, we explore how the unmatched continuity and breadth of the S&P Global BMI historical data provides superior value to market participants.

Float adjustment—now the industry standard for equity benchmarks—is necessary to accurately reflect shares that are available to global investors. This is particularly important in many international markets where governments and other strategic holdings tend to represent a significant portion of total equity market cap.

The relative stability derived from a consistent approach to float adjustment throughout history can be seen in the respective return series of similar global benchmarks (see Exhibit 2). Using the S&P Global LargeMidCap returns against competitor benchmarks, we compare the annualized tracking error in three consecutive three-year periods: 1) when S&P DJI was the only provider incorporating float adjustment; 2) during the MSCI and FTSE transition to float adjustment; and 3) after alignment. After 2001, once MSCI and FTSE completed the transition to float adjustment, the tracking error between the S&P Global LargeMidCap and the alternative indices was greatly reduced.

While the convergence of best practices by index providers has led to similar risk/return profiles of the indices in recent years (see Exhibit 3), users should be mindful of the differences that once existed. Significant breaks in methodology construction over time can introduce biases in historical index data, as the change in the methodology itself influences the characteristics and performance of the index.

The continuous inclusion of large-, mid-, and small-cap stocks in a single benchmark and consistent use of float adjustment since 1989 means the S&P Global BMI Series eliminates important sources of bias compared with other indices that have undergone fundamental methodology changes during more recent times. Even if a particular index is used for official benchmarking purposes, the S&P Global BMI Series may serve as a valuable secondary data source—particularly if one is seeking an optimal index universe for historical research purposes, such as to back-test global investment strategies.

For further reading, see The S&P Global BMI: Providing Consistent Insights into Global Equity Markets since 1989.

The posts on this blog are opinions, not advice. Please read our Disclaimers.