Get Indexology® Blog updates via email.

In This List

Unsung Stories of 2020

Indexing Biodiversity: Examining Water as an Asset Class

Performance of Indian Capital Markets in 2020

Oscillations in Opportunity

Style Rotation through the Revenue Exposure Lens

Unsung Stories of 2020

Contributor Image
Sherifa Issifu

Senior Analyst, U.S. Equity Indices

S&P Dow Jones Indices

Early in 2020, global stock markets acted in concert during the sell-off, bottoming out around the world in late March. However, the extent to which different markets declined, and the strength of the subsequent recovery, differed significantly around the world. With 2020 now in hindsight, S&P DJI’s range of global equity indices tell a tale of distinctive performances, as well as a returning importance of swings in the currency markets.

On the surface, it was a good year: the S&P Global BMI finished with a full-year total return of 17% in U.S. dollars, with both emerging and developed components performing similarly. However, Latin America, Eastern Europe, and the U.K. closed 2020 lower—driven by risk-off sentiment and an initial move to safety that led to their slower recoveries. Meanwhile, the Nordic markets outperformed, while China and South Korea soared.

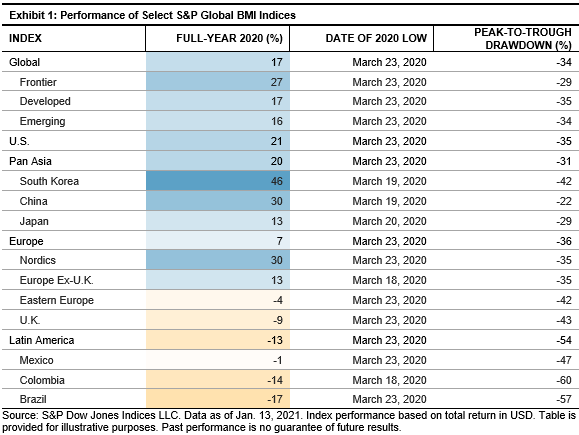
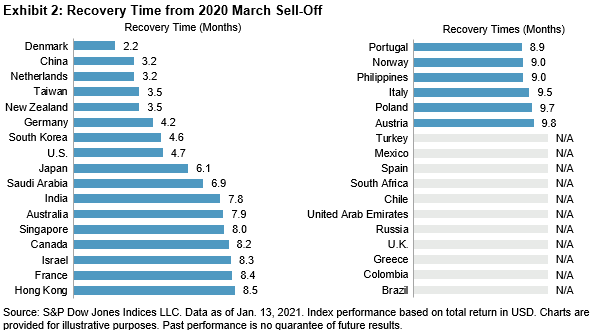
As shown in Exhibit 1, most of the 2020 lows occurred nearly simultaneously around March 23, 2020, but the scale of the drawdown, and the timing and speed of the recoveries, differed greatly.1 Exhibit 2 gives a more granular picture, plotting the time taken by a range of countries to get back to winning ways. Northern European countries were among the first to return to their highs, with Denmark taking just over two months to do so, and recovery times across the Scandinavian region averaging only four months. However, the global recovery really began with China: the S&P China BMI saw a smaller drawdown in March, setting a lower hurdle for redemption. The index took approximately three months to regain its losses—kicking off a wave of subsequent stock market highs. At the bottom of the spectrum, many Latin American countries and the U.K. still have some catching up to do.

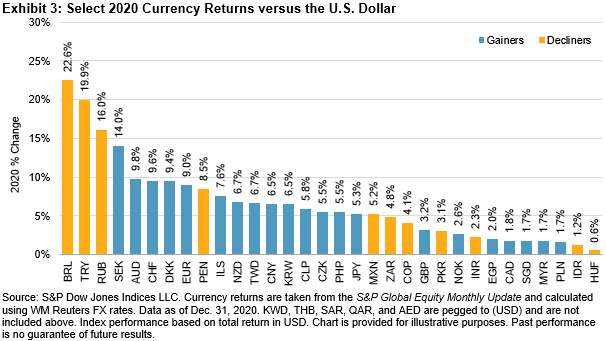
Currency was a major factor in the performance of some markets, and Brazil in particular. In local currency terms, the S&P Brazil BMI had a respectable gain of 6%, but it declined 17% in U.S. dollar terms, driven by a 23% weakening of the Brazilian real (BRL) in 2020. A similar impact from currency meant 2020 gains dwindled when converted into U.S. dollars across several emerging markets, including Russia, Turkey, and Mexico. Part of this disparity was a result of the differences in the ability of countries to provide stimulus to their economies during the COVID-19 pandemic—as not every country could do “whatever it takes.”

Exhibit 3 shows that the currency markets hosted big winners as well. The S&P Europe BMI was lifted to a positive return (in U.S. dollar terms) entirely thanks to currency movements, after a 9% swing in the euro versus the U.S. dollar in 2020. There were similarly large moves for the greenback among a range of developed market currencies, including the Australian dollar (AUD) and the Nordic currencies (SEK and DKK).

Overall, 2020 was a rocky year for global markets, but with 2021 starting off on a positive note and signs of strong recoveries in the cyclical sectors that dragged down returns last year, we should see more country and regional equity markets fully recover from the 2020 sell-off and begin to write new stories for the year.


1 We define a recovery as the first point at which each index posted a new high for the year subsequent to its March 2020 low.


The posts on this blog are opinions, not advice. Please read our Disclaimers.

Indexing Biodiversity: Examining Water as an Asset Class

Water is one of the world’s most essential commodities, but it is at risk from overuse, pollution, and soaring demand. S&P DJI’s Tianyin Cheng joins Redsand Ventures’ Colleen Becker to explore new tools for understanding and accessing water assets.

Learn more: https://www.spglobal.com/spdji/en/education/article/investing-in-water-for-a-sustainable-future

The posts on this blog are opinions, not advice. Please read our Disclaimers.

Performance of Indian Capital Markets in 2020

Contributor Image
Ved Malla

Associate Director, Client Coverage

S&P Dow Jones Indices

Indian capital markets had an exceptional year in 2020. The COVID-19 pandemic initially had an adverse impact on Indian capital markets, as indices across size and sectors fell during the period from February 2020 to May 2020. However, from June 2020 onward, all size and sector indices had a bull run through the end of the year. The S&P BSE SENSEX TR increased from 60,211.40 on Dec. 31, 2019, to 70,543.23 on Dec. 31, 2020—a one-year absolute return of 16.31%.

Exhibit 1 and 2 showcase returns for India’s leading size indices in 2020.

From Exhibits 1 and 2, we can see that all five size indices performed well, and returns were promising for large-, mid-, and small-cap segments. The returns of the small-cap and mid-cap segments were better than those of the large-cap segment. The S&P BSE SmallCap and S&P BSE MidCap posted one-year absolute returns of 33.53% and 21.31%, respectively, while the S&P BSE LargeCap and S&P BSE SENSEX returned 16.31% and 17.16%, respectively.

Exhibits 3 and 4 showcase returns for the 11 leading sector indices for India in 2020.

In Exhibits 3 and 4, we can see that most of the sector indices posted promising returns in 2020. The S&P BSE Healthcare and S&P BSE Information Technology performed exceptionally in 2020, with absolute returns of 62.61% and 60.05%, respectively. The S&P BSE Finance and S&P BSE Utilities were the worst-performing indices in 2020, with absolute returns of 1.25% and 4.18%, respectively.

To summarize, we can say that except for the couple of months at the beginning of the COVID-19 pandemic, the bulls had their way in 2020, and indices across size, segments, and sectors gave promising returns in 2020.

The posts on this blog are opinions, not advice. Please read our Disclaimers.

Oscillations in Opportunity

Contributor Image
Anu Ganti

U.S. Head of Index Investment Strategy

S&P Dow Jones Indices

2020 was a year of two reversals for the market. First, equities recovered from the depths of March to finish the year strongly, and second, smaller-cap and value stocks staged a roaring comeback in the final quarter.

We can better understand the second reversal by analyzing the market’s distribution of returns and the performance of stocks relative to the index as a whole. Exhibit 1 illustrates this for the S&P 500® for the past 20 years. Of the 980 stocks that were in the index during this period, only 211, or 22%, outperformed. When only 22% of the stocks beat the market, stock picking is hard, underscoring the persistent underperformance of most active managers.

Exhibit 1 summarized 20 years of data, but we also see the challenges of stock selection in most individual years, and 2020 was no exception. Exhibit 2 shows that the S&P 500’s return for 2020 (18.4%) was much higher than the median stock’s return of 8%. The outperformance of large-cap stocks meant that only 34% of stocks beat the index.

However, the path for stock-pickers was not a straight one in 2020. Exhibit 3 shows that from Q1 through Q3, the S&P 500 posted a return of 5.6%, as mega-caps outperformed during the period. As a result, only 35% of stocks were able to outperform the index.

In contrast, in Q4, the market reversed course, where the S&P 500’s return of 12.2% was much below the median of 17.1%, signaling the recovery of smaller-cap stocks. Therefore, 60% of stocks were able to outperform the index, almost double what we saw in the first three quarters.

This analysis has interesting implications for active management: The dominance of mega-caps hindered stock selection from Q1 through Q3. Meanwhile, in Q4, the comeback of smaller caps lowered the threshold for success, leading to a greater hit rate of outperforming the index. It is not solely the distribution of returns, but the return distribution across the cap range that matters.

As most active portfolios are closer to equal than cap weighted, it is also important to remember that smaller-cap outperformance favors equal-weight indices, which led to S&P 500 Equal Weight’s recent reversal. If the trends from Q4 continue, we can anticipate a more favorable environment for active managers. Whether they will be able to take advantage of it remains to be seen.

The posts on this blog are opinions, not advice. Please read our Disclaimers.

Style Rotation through the Revenue Exposure Lens

Contributor Image
Hamish Preston

Head of U.S. Equities

S&P Dow Jones Indices

One of the major trends in the last few years has been the outperformance of large, growth-oriented stocks and, at first glance, 2020 represented a continuation of this trend. For example, the S&P 500® Growth (33.5%) outperformed the S&P 500 Value (1.4%) by 32.1% last year, the largest difference in calendar year total returns between the two indices, ever.

However, focusing on the overall picture for 2020 ignores a recent reversal in fortunes—Value outperformed Growth by 3.8% between the end of September and latest annual S&P U.S. Style Indices reconstitution (Dec. 18, 2020), contributing to Value’s second-largest quarterly outperformance since 2009 (Value beat Growth by 6.9% in Q4 2016).

Much of the outperformance in Q4 2020 can be attributed to the beginning of the COVID-19 vaccine rollout, which fueled expectations of an economic recovery and lifted many value-oriented stocks that were particularly impacted by the COVID-19 correction. Overall, S&P 500 Value constituents posted higher returns than their Growth counterparts in 7 of the 11 GICS® sectors leading up to the December 2020 style reconstitution.

More recently, Value has outperformed by around 2% since the results from the latest reconstitution went into effect (prior to the open on Dec. 21, 2020). Value-oriented Financials provided tailwinds, lifted by increased investor speculation that interest rates will rise in 2021 in response to higher U.S. inflation expectations.

While it remains to be seen which news stories will dominate headlines this year, georevenue exposure may offer insights into the relative fortunes of Value and Growth. For example, Exhibit 3 shows that value-oriented companies are typically more domestically focused than their growth counterparts: the sales-weighted average U.S. revenue exposure is greater for many sectors in the Value index compared to the Growth index. This suggests that news that causes investors to change their U.S. economic outlook and/or expectations for domestic consumers’ spending—such as the vaccine rollout late last year—may have an outsized impact on Value’s returns. Similarly, Growth’s fortunes may be more sensitive to global narratives, especially as they relate to some of the largest market constituents.

As a result, the recent reversal in Value’s fortunes has led some investors and commentators to suggest that we may be witnessing a long-anticipated rotation away from Growth and into Value. Although we shall see whether there is growth in value or value in growth, differences in georevenue exposure may be a useful way to understand movements across style indices.

The posts on this blog are opinions, not advice. Please read our Disclaimers.