Get Indexology® Blog updates via email.

In This List

Are Asian Companies More or Less Carbon Efficient Than Their Global Peers?

How and Why Are Market Participants Accessing REITs in the Current Climate?

Reflecting on the Inflection Points of 2020

A Global Macro Look Back at Commodities in 2020

Persistence

Are Asian Companies More or Less Carbon Efficient Than Their Global Peers?

Contributor Image
Liyu Zeng

Director, Global Research & Design

S&P Dow Jones Indices

With the launch of the S&P Global Carbon Efficient Index Series in 2018, S&P DJI introduced the S&P Carbon Global Standard, a proprietary carbon classification system that assigns carbon deciles to companies within their respective industry groups. The framework uses carbon-to-revenue footprint (carbon intensity) for companies in the S&P Global LargeMidCap to determine carbon decile thresholds for each industry group and defines companies’ carbon deciles according to these thresholds.

To compare the carbon efficiency of Asian companies with their global peers, we evaluated the carbon decile ranks of companies in the S&P Global BMI Series1 for Australia, Hong Kong, Japan, South Korea, China, India, and Taiwan. We compared the distribution of companies across high- (1st-3rd), mid- (4th-7th), and low-carbon deciles (8th-10th) within each industry group for each market.

A higher proportion of companies in high- (low-) carbon deciles implies companies in that industry group tended to be more (less) carbon efficient than their global industry group peers (in green and red, respectively).

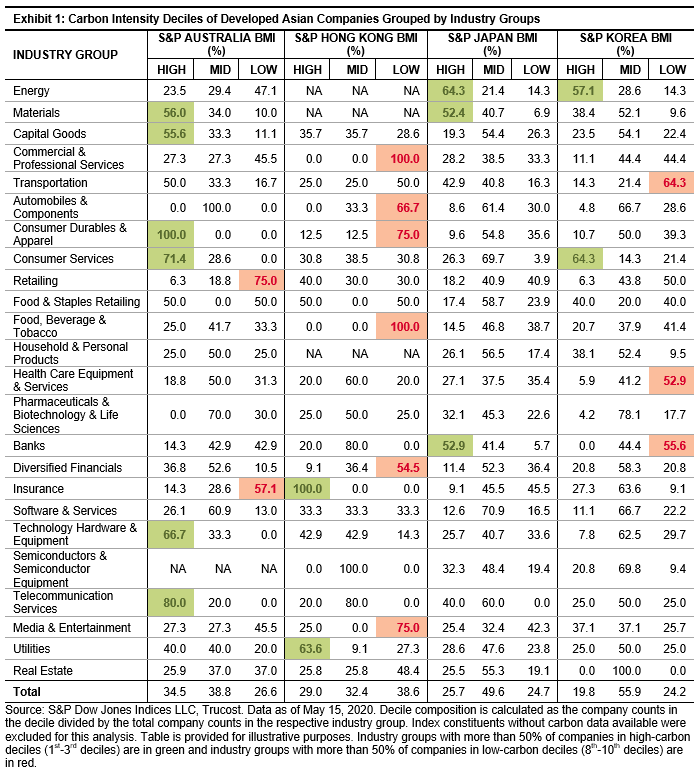
Australia had the highest portion of high-carbon decile ranked companies (34.5%), while Hong Kong had the highest percentage of lower-carbon decile ranked companies (38.6%).  Carbon decile ranks for Materials companies were the most favorable across developed Asian markets, with a higher concentration of companies in high- versus low-carbon deciles.  In contrast, more companies with a low-carbon rank were seen in Commercial & Professional Services and Food, Beverage & Tobacco.

In Australia, a majority of Consumer Durables & Apparel, Telecommunication Services, Consumer Services, Technology Hardware & Equipment, Materials, and Capital Goods companies were in high-carbon deciles, while a larger portion of low-carbon decile ranked companies were seen in Retailing and Insurance.

In contrast, most Commercial & Professional Services, Food, Beverage & Tobacco, Consumer Durables & Apparel, Media & Entertainment, Automobiles & Components, and Diversified Financials companies received low-carbon decile ranks in Hong Kong, and a high concentration in high-carbon deciles was only seen in Insurance and Utilities.

Over 50% of Japanese Energy, Banks, and Materials companies had favorable decile ranks, while the highest concentration of low-carbon decile ranked companies was found in Insurance, Media & Entertainment, and Retailing.

In South Korea, 64.3% of companies in Consumer Services received high decile ranks, while over 50% of companies in Transportation, Banks, and Health Care Equipment & Services ranked in low deciles compared with their industry group peers.

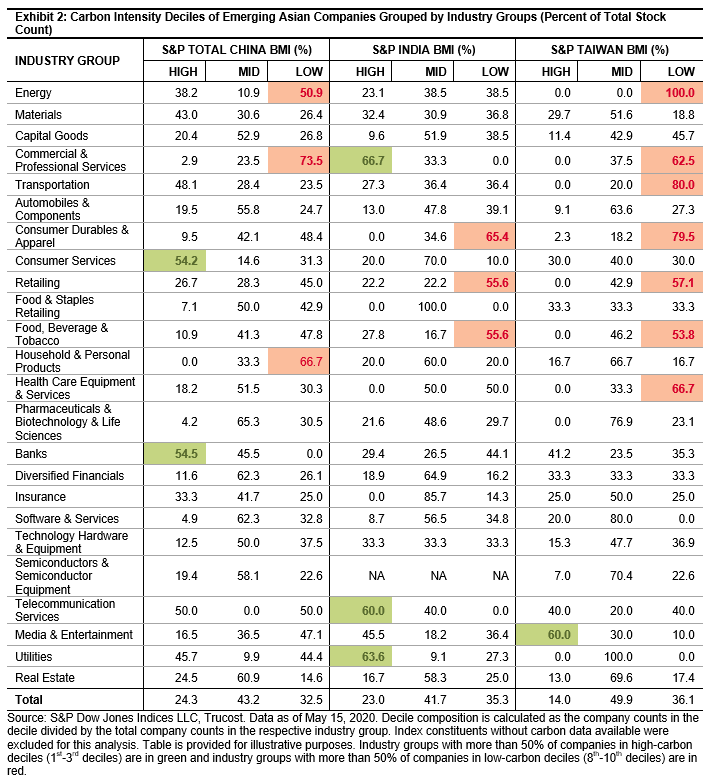
Among emerging Asian markets, the percentage of companies in low-carbon deciles tended to be higher than those in high-carbon deciles, and Taiwan had the highest number of industry groups with a high concentration in low-carbon decile companies. Emerging Asian market companies tended to be less carbon efficient than those in developed Asian markets. Carbon decile ranks for companies in Consumer Durables & Apparel, Retailing, and Food, Beverage & Tobacco tended to be the least carbon efficient among emerging Asian markets.

Over 50% of Chinese Banks and Consumer Services companies were ranked in high-carbon deciles, while over 50% of companies in Commercial & Professional Services, Household & Personal Products, and Energy received low decile ranks.

A high concentration of high-carbon deciles was seen in Indian Commercial & Professional Services, Utilities, and Telecommunication Services companies, while the highest portion of companies in Consumer Durables & Apparel, Retailing and Food, Beverage & Tobacco received low-carbon decile ranks.

In Taiwan, Media & Entertainment was the only industry group with over 50% of companies ranked in high-carbon deciles. A majority of companies in Energy,2 Transportation, Consumer Durables & Apparel, Health Care Equipment & Services, Commercial & Professional Services, Retailing and Food, Beverage & Tobacco received low-carbon decile ranks.

The S&P Global Carbon Standard not only provides a classification system to evaluate companies’ carbon efficiencies, it also serves as a critical framework for reweighting companies in the S&P Global Carbon Efficient Indices, which assign index weights toward companies with low-carbon intensities and penalizes those with high-carbon intensities to achieve an index portfolio with reduced carbon intensities.

1 The S&P Global BMI Series is designed to measure the performance of the broad equity market of the respective country or region. For more details, please see https://www.spglobal.com/spdji/en/indices/equity/sp-global-bmi/#overview.

2 There was only one company in the Energy sector of the S&P Taiwan BMI as of May 15, 2020.

The posts on this blog are opinions, not advice. Please read our Disclaimers.

How and Why Are Market Participants Accessing REITs in the Current Climate?

Can REITs help unlock potential income opportunities in today’s markets? S&P DJI’s Priscilla Luk and Samsung Asset Management’s Alex Yang take a closer look at practical applications for REITs in the current environment.

The posts on this blog are opinions, not advice. Please read our Disclaimers.

Reflecting on the Inflection Points of 2020

Contributor Image
Jim Wiederhold

Former Director, Commodities and Real Assets

S&P Dow Jones Indices

Last year might end up being known as the year of countless inflection points. Narratives that were playing out over months and years were accelerated or reversed with volatility not seen since World War II. Among commodities, there were new all-time highs hit in gold and new all-time lows that reached into negative territory for crude oil. Exhibit 1 shows that while the S&P GSCI dropped 24% for the year, three sectors finished positive and a monstrous 69.24% separated the best-performing S&P GSCI Precious Metals from the worst performing S&P GSCI Energy.

One of the most monumental narratives of 2020 involved the April dip into negative territory for WTI Crude Oil front month futures. Fiona Boal explained what happened during this extreme time in commodities history and how Crude Oil Can Get Carried Away by Contango. Inflows into ETFs tracking crude oil exploded, with many market participants trying to buy the dip. Economies have slowly reopened since, but energy usage is still below 2019 levels. The one bright spot within energy was the S&P GSCI Unleaded Gasoline, which rose 12.82% in December. Holiday travel demand picked up in the Western Hemisphere while demand overall for autos remained strong, as they are seen as one of the safest ways to travel during a pandemic. The S&P GSCI Natural Gas dropped 12.56% in December as warm winter forecasts reduced the need to stock up for building heating needs.

The S&P GSCI Agriculture and S&P GSCI Livestock took two very different paths in 2020. The former rose 14.94% while the latter fell 22.10%. As these have been somewhat correlated historically due to the use of grains as feed for livestock and geographically being grown in some of the same areas, 2020 was an inflection point. Except for coffee, every S&P GSCI Agriculture constituent rose, most by double digits. The most fundamental reason for bullishness was the surprise shortfall in grain stocks, which pushed some grains to multi-year highs. Following years of oversupply, the increasingly unpredictable weather patterns and the return of purchases from large consumer nations such as China represented an inflection point for agricultural commodities in 2020.  The 2020 Atlantic hurricane season had the most hurricanes on record, with 30 named storms, over two and a half times more than the average. While many meat producers were hit hard with COVID-19 outbreaks in their plants reducing supply, the hog herd in China returned with gusto after 2019’s African Swine Fever outbreak. The supply in China more than offset any reduction in the U.S. On the demand side, U.S. restaurant dining picked up during Q3 2020, but fell again to June levels by the end of Q4.

Green technologies were building momentum for years, but 2020 might be the inflection point where they truly took off. Besides rare earth metals, the building blocks for many of these technologies come from the S&P GSCI Industrial Metals and S&P GSCI Precious Metals. All five constituents of the S&P GSCI Industrial Metals are used in low-carbon technologies, with aluminum, nickel, and copper used the most. Within the precious metals space, silver is used extensively in solar photovoltaics, LEDs, and electric vehicles. Exhibit 2 shows metal use in select low-carbon technologies.

Any of the S&P GSCI Single Commodities Indices could be used to implement tactical views on the direction of a single commodity. S&P Dow Jones Indices calculates hundreds of indices based on commodities around the world in real time. Check out our website for more information.

The posts on this blog are opinions, not advice. Please read our Disclaimers.

A Global Macro Look Back at Commodities in 2020

Contributor Image
Jim Wiederhold

Former Director, Commodities and Real Assets

S&P Dow Jones Indices

Over the past 50 years, commodities have displayed mostly positive yearly performances, as measured by the world-production-weighted S&P GSCI. The index rose in 34 out of those 50 years, or roughly 70% of the time. Usage as an inflation hedge coupled with its low correlation to other asset classes has given market participants ample reasons to fit commodities into investment portfolios. However, the past decade has been an exception. Commodities only rose four times during the 2010s, making it the worst decade for the asset class, with an annualized 10-year return of -8.65% for the S&P GSCI. In 2020, the S&P GSCI fell 24%, pulled down by the worst-performing energy commodities, as shown in Exhibit 1. Energy commodities make up over 60% of the index. The underperformance of livestock also negatively contributed, but not to the same degree.

While other asset classes like equities and credit were able to jump back up quickly to their multi-year trends after the lows in March 2020, many commodities could not claw back out of negative territory. This points to the unique property of commodities as a spot or real-time asset. Equities are a more anticipatory asset, looking ahead to the environment months or years into the future. Commodities tend to represent the current environment at a specific moment in time, represented by the nearby front-month futures contracts that make up the S&P GSCI. The current environment and outlook for commodities is uncertain; with increased concern about inflation, but no solid signs yet, we exited the recent disinflationary environment.

Historically, commodities have tended to do well during times of high inflation, as shown in Exhibit 3. We may be entering such an environment. Massive amounts of fiscal and monetary stimulus could lead to inflation. An outsized global economic recovery could inflate prices if demand explodes but production struggles to keep up. Higher costs to produce goods and rising wages could also be factors of inflation. After years without concern over inflation, market participants started adding inflation hedges to their portfolios in 2020.

The S&P GSCI seeks to offer market participants the chance to hedge against inflation, diversify a portfolio, or take a directional approach to the broad commodities market.

The posts on this blog are opinions, not advice. Please read our Disclaimers.

Persistence

Contributor Image
Craig Lazzara

Former Managing Director, Index Investment Strategy

S&P Dow Jones Indices

Lyndon Baines Johnson became President of the United States at a moment of national trauma, and left office at a time of tremendous political division. Despite a landslide electoral victory in 1964 and notable legislative achievements, his was not a happy presidency. LBJ observed, in fact, that “being President is like being a jackass in a hailstorm. There’s nothing to do but to stand there and take it.”

Regardless of whether it’s true of the presidency, Johnson’s analogy was clearly applicable to equity investors in 2020. Consider the vicissitudes of the S&P 500®:

  • The year got off to a good start, as the market rose by 5.1% until peaking on February 19.
  • Then began one of the most precipitous declines in market history. The S&P 500 fell by -33.8% between February 19 and March 23. (In the global financial crisis of 2007-09, the comparable decline required a full year.) When the market closed on March 23, the S&P 500’s year-to-date total return stood at -30.4%.
  • In an extraordinary rebound, the S&P 500 rallied by 61.4% between March 23 and September 2.
  • This was followed by a -9.5% decline until September 23, a 9.3% gain through October 12, and a -7.4% decline through October 30.
  • The year ended with a gain of 15.2% in November and December.

Between March 23 and year-end, in other words, the S&P 500 rose 70%. What did an investor have to do to benefit from this remarkable turnabout in the equity market?

Nothing. We’ve argued before that sometimes successful portfolio management requires holding positions when one’s natural instinct is to sell, and 2020 provided an emphatic demonstration of that principle.

Although last year’s recovery was unusually large, Exhibit 1 shows that it was by no means unique. Over the last 30 years, the annual total return of the S&P 500 has averaged 12.2%. But it’s rare for the market to rise without a pause; in 27 of those 30 years, at some point during the year the S&P 500 has had a negative total return. Across all 30 years, the total return at the year’s low point was -9.1%. The average recovery from the annual low has been 23.8%.

Even in extreme declines, standing firm can pay off. There have been ten years (including 2020) when the S&P 500’s peak-to-trough decline exceeded 15%; in half of them, the market finished in positive territory. A year later, the gain from the bottom averaged 38%.

Market history tells us that selling can be most damaging precisely when it’s most tempting. The key to success in 2020 was resisting the urge to panic when panic seemed like the most reasonable path. Like Johnson’s proverbial jackass, the only requirement was “to stand there and take it.” Investors who tolerated the downdrafts were well-rewarded by year end.

The posts on this blog are opinions, not advice. Please read our Disclaimers.