Get Indexology® Blog updates via email.

In This List

Crude Oil Can Get Carried Away by Contango

2020 – The Dawn of the Passive Investing Era in India: Part Two

Is ESG a Factor? The S&P 500 ESG Index’s Steady Outperformance

Why The S&P 500® Matters in India

From COVID-19 to U.S.-China Tensions, What to Expect Next for Chinese Equities

Crude Oil Can Get Carried Away by Contango

Contributor Image
Fiona Boal

Managing Director, Global Head of Equities

S&P Dow Jones Indices

The long-term impact of the COVID-19 pandemic on commodities markets is not yet known. There have undoubtedly been short-term impacts on supply and demand, ranging from a collapse in oil demand to supply disruptions at individual mines as a result of COVID-19 infections among mine employees.

The longer-term implications of these demand and supply shocks, while uncertain, will likely follow a well-trodden path that eventually leads to market equilibrium. What is less clear is the long-term impact on the commodity investment landscape. The negative price action in the WTI crude oil futures market in April 2020 may well force investors to rethink the standard narrative around investing in commodities.

For investors, it is extremely difficult to access the return streams of physical commodities traded in the spot market. The closest approximation is a strategy that invests in rolling front-month futures contracts. That is exactly what the S&P GSCI Crude Oil does. The headline S&P GSCI series of indices follows a rolling schedule that ensures that futures positions roll to the following month’s contract well before the expiration of the current contract. This ensures that investors do not hold any exposure as a futures contract enters expiration, which is particularly important for commodity futures that allow for physical settlement.

With that in mind, we examined the events that took place in the oil market in April and early May 2020. The S&P GSCI Crude Oil had already rolled into the June contract when the May WTI crude oil futures contract closed at USD -37.63 per barrel on the penultimate day of trading. The front-month rolling S&P DJI Commodities Indices that included WTI crude oil therefore did not directly contend with negative prices. Instead, they fell prey to the super contango in the WTI crude oil market.

When a futures curve is in contango, investors pay to roll futures contracts. Commonly referred to as a negative roll yield, contango results in a significant drag on index performance. Super contango occurs when the spot price for a commodity trades substantially below the futures price. Super contango usually occurs when storage space becomes scarce due to excess supply—meaning that the cost of carry (the cost of storing a physical commodity) increases. Exhibit 1 presents the impact of super contango on the WTI crude oil market by illustrating the difference in performance between the S&P GSCI Crude Oil spot return and the S&P GSCI Crude Oil Excess Return (ER) since the beginning of 2020.

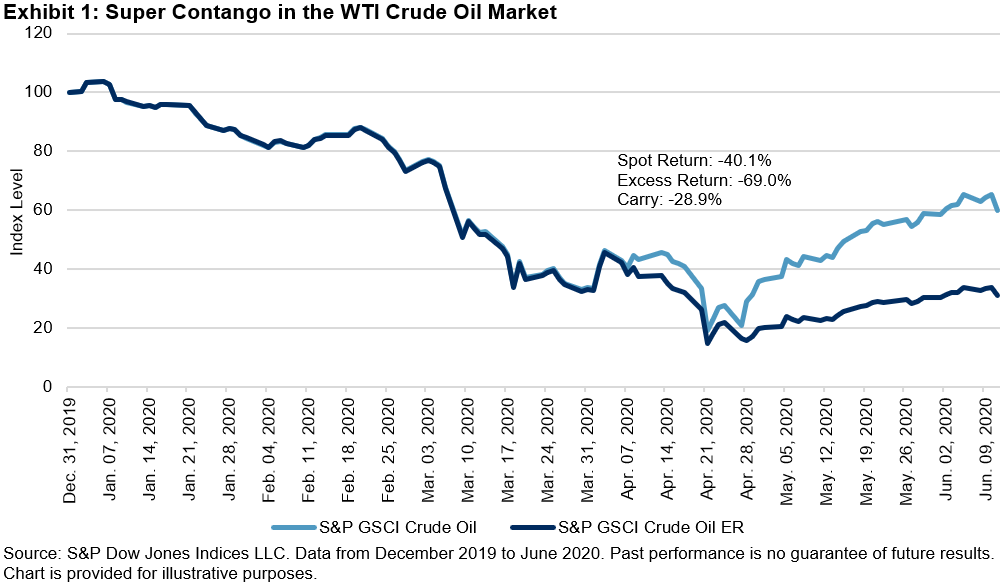
The overarching lesson for investors from the oil market is that there are additional risks when investing in products that replicate price movements on a futures curve. The risk is particularly acute in extreme conditions when returns associated with the underlying product become magnified as futures prices react to market conditions.

In short, market participants need to be aware of the unique return streams associated with futures-based investment strategies, especially the investment implications of holding long-only commodity positions at the front of the futures curve during periods of extreme market stress.

The posts on this blog are opinions, not advice. Please read our Disclaimers.

2020 – The Dawn of the Passive Investing Era in India: Part Two

Contributor Image
Koel Ghosh

Former Head of South Asia

S&P Dow Jones Indices

The previous blog highlighted the significant shifts to passive investing in India. However, Indian passive trends have continued to favor plain vanilla indices due to their ease of understanding, rather than exploring alternative thematic indices, such as the S&P Kensho New Economies Indices or factor Indices. However, once the acceptability and acceptance of passive investment grows, the need for variety will arise. The simple progression would be toward factor play initially.

The month-end statistics for May 2020 revealed the parity of global and Indian markets in the quality factor. Companies with low leverage and high returns on equity have rewarded the quality factor. The S&P BSE Quality Index gained 2% in May 2020 and outperformed the S&P BSE SENSEX by 11%. The U.S., European, and Australian markets witnessed the same monthly trends (see Exhibit 1).

Taking a long-term perspective on any investment strategy is essential, including passive strategies. Exhibit 2 shows that market cycles over different time periods reflected different performance results for the quality factor, however, it was the long-term winner.

There is a need for more education and investor awareness on the benefits of passive investing. It is important that investors understand that passive investing involves an investment strategy that tracks or mimics an index. The advantages of diversification, low concentration risk, transparency, and lower costs strengthen the case for choosing this option. Index-based investing makes it easy for those who are not actively tracking markets by allowing them index-based returns.

Historically, Indian markets have been a pure active investing play in which funds were deployed by active fund managers in various strategies. With the dawn of passive investing, the value of low-cost indices with no active bias, consistent methodologies, and transparent rules started gaining attention. The SPIVA® (S&P Dow Jones Indices versus Active) India Scorecard added some more conviction to the passive claims. The SPIVA India Scorecard, which was first published in 2013, has laid witness to the fact that benchmarks have outperformed active funds. One such example has been the large-cap space that has witnessed a consistent 50% and above outperformance of benchmarks over active funds in the 5-year and 10-year investment horizons.[1]

The Indian passive wave has received the necessary nudge by initiatives from the Indian government, be it the Employees Provident Fund allocations to exchange-traded fund (ETFs) in benchmark indices, the disinvestment program being mobilized via the ETF route, or encouraging retail participation in fixed income via passive strategies. These initiatives have provided the necessary impetus to the passive market in India to gather more participation from product issuers and investors. While it is still early days for a wider selection and more innovative products, this is a great beginning to an optimistic growth trajectory for the Indian passive market.

[1] SPIVA India Year-End 2019 Scorecard.

The posts on this blog are opinions, not advice. Please read our Disclaimers.

Is ESG a Factor? The S&P 500 ESG Index’s Steady Outperformance

Contributor Image
Ben Leale-Green

Former Associate Director, Research & Design, ESG Indices

S&P Dow Jones Indices

Since launching the S&P ESG Index Series, we have been continuously asked the same question: Can environmental, social, and governance (ESG) be considered a factor that outperforms? In short, since its launch in January 2019, the S&P 500® ESG Index has outperformed (see Exhibit 1).

We further analyzed the performance characteristics of the S&P 500 ESG Index against our suite of S&P Factor and Style Indices (see Exhibit 2).

While growth, quality, and momentum fluctuated their way to a position of strong relative outperformance, ESG showed slow, steady outpeformance over the S&P 500. Size, low volatility, and value performed relatively worse over the period (see Exhibit 3). This distinction in behavior may be explained by the construction and objective of each index. While the S&P 500 ESG Index aims to deliver core-like returns with low tracking error to the S&P 500, the S&P Factor and Style Indices are designed to target differentiated and less correlated returns to the benchmark.

However, it is unsurprising to note that the excess return of the S&P 500 ESG Index was negatively correlated to the S&P 500 Equal Weight Index, which was likely attributable to the large-cap bias present in the S&P 500 ESG Index.

Given the variation of active risk of each index versus the S&P 500, we normalized the relative performance (excess returns/tracking error) to understand the consistency of outperformance observed. These form information ratios (see Exhibit 4).

What drove this outperformance and can we expect it to continue? The drivers of ESG outperformance require further analysis than this blog provides. The S&P 500 ESG Index’s outperformance may be attributed to a successful mix of factors during the period, uncorrelated ESG alpha, inflows into ESG strategies, a combination of these, or something else.

Factors such as value, momentum, and size have been studied in both industry and academia for many decades, whereas ESG score-based indices are a relatively recent phenomenon. In ESG’s shorter lifespan, there have been large-scale shifts to integrating sustainability-based criteria into the investment process. At S&P Dow Jones Indices, we are fortunate that S&P Global (our parent company) acquired SAM, who has been integrating ESG scores into the investment process for over 20 years. In this time, company disclosure has improved and methodologies have evolved with sustainability-based norms. When considering this, having the same degree of confidence in the future outperformance of ESG may be naive.

How has ESG performed in other regions? With the exception of Japan, which showed a small underperformance, each region outperformed, including Europe, the U.S., Latin America, and other global variants (see Exhibit 5).

Overall, since its launch, the S&P 500 ESG Index has seen slow, gradual outperformance over the S&P 500, with compelling information ratios compared with S&P Factor and Style Indices. Similar outperformance has been observed in other regions, too. Will this continue? We’ll need more time to gain reasonable confidence, but it does make an attractive graph for now.

The posts on this blog are opinions, not advice. Please read our Disclaimers.

Why The S&P 500® Matters in India

Contributor Image
Hamish Preston

Head of U.S. Equities

S&P Dow Jones Indices

We recently held a webinar examining the relevance of the S&P 500 to India-based investors, the potential diversification benefits of incorporating U.S equity exposure to an existing allocation, as well as showing how difficult active managers have found it to beat the index, historically.  You can watch a replay of the webinar here; here are a few highlights.

Having a U.S. view is important for investors around the world.

As we have highlighted before, having a U.S. view is vital in a global equity portfolio context.  U.S. companies account for a significant proportion of the global equity market capitalization, therefore trends impacting these companies will be relatively important in driving global equity returns.  For example, the total market capitalization of S&P 500 companies is many multiples larger than other country components of the S&P Global BMI, our global equity benchmark.

Combined with the fact that the S&P 500 accounts for over 80% of the U.S. market, it is perhaps unsurprising that so many people turn to the index to gauge U.S. market performance.  Indeed, our latest Survey of Indexed Assets shows that over USD 11.2 trillion was indexed or benchmarked to the S&P 500 at the end of 2019.

The S&P 500 can help to diversify domestic sector biases.

For exposure to certain sectors, Indian investors may find it beneficial to turn to the U.S. – S&P 500 companies accounted for most of index market capitalization in the S&P Global BMI Information Technology, Health Care and Communication Services sectors at the end of May.  Such sizeable representation helps to explain why the S&P 500 has higher weights in these market segments compared to the Indian equity market, as represented by the S&P BSE 500 index.  More broadly, differences in sector breakdowns in the two indices illustrate how the S&P 500 can help to diversify the Indian equity market’s sector biases.

Active managers have struggled to beat the S&P 500, historically.

An important choice for investors is whether to take an index-based approach or to employ an active manager to try and outperform the market. While this debate seems to be evergreen – there are ardent supporters on both sides – S&P Dow Jones Indices publishes semi-annual SPIVA® scorecards to inform the debate.  In particular, SPIVA scorecards compare the performance of active managers against their S&P index benchmarks across multiple regions.

Exhibit 3 shows the majority of large-cap U.S. active managers typically underperformed the S&P 500 since 2001:  the majority of funds underperformed in 16 of the last 19 calendar year periods.  Given this underperformance is frequently observed on a risk-adjusted basis and the start of 2020 offered active managers no place to hide, many may wish to consider the potential benefits of taking an index-based approach.

To sign up for S&P Dow Jones Indices’ scorecards and market commentary, use this link.

The posts on this blog are opinions, not advice. Please read our Disclaimers.

From COVID-19 to U.S.-China Tensions, What to Expect Next for Chinese Equities

Contributor Image
Priscilla Luk

Managing Director, Global Research & Design, APAC

S&P Dow Jones Indices

On May 29, 2020, I joined S&P Global’s The Essential Podcast, “A View to the Future – China Beyond the Pandemic,” to discuss the Chinese equity market’s performance and the macroeconomic trends during and beyond the COVID-19 pandemic. This blog includes some key highlights we discussed, along with the related index performance observed in the Chinese equity market.

As mentioned in our previous blog, “How the Chinese Equity Market Responded to the Domestic and Global Coronavirus Outbreak,” the China A-shares market experienced a substantial drawdown, with significant industry return spreads during the early and middle stages of the COVID-19 pandemic in China. The Health Care sector performed the best, while consumer-based constituents such as airlines and hotels lagged the most.

However, as China is a non-oil-exporting country with minimized exposure to falling oil price and the Chinese renminbi has remained largely stable relative to other emerging market currencies, Chinese equities have experienced lower volatility and have become an unexpected stabilizing force for emerging markets (see “An Unlikely Stabilizer in Emerging Markets” for more details). Year-to-date, the S&P Total China Domestic BMI outperformed the S&P Emerging ex-China BMI by 21.4% in USD terms.

Companies engaging in internet business and technologies that provide contactless services performed relatively well during the pandemic. Due to the lockdown, the time people spend working from home, online shopping, and viewing social media and online entertainment has significantly increased. This resulted in a shift in business and consumer behavior, and this trend has continued even post-lockdown.

During to the COVID-19 crisis, rising tensions between the U.S. and China were seen with continuous investment restrictions, export controls, tariffs, and policies to slow the pace of technology transfer to China. As pointed out in “A Great New Game—China, the U.S. and Technology,” published by S&P Global’s China Senior Analyst Group last year, the focus of U.S. trade and investment policies has turned to technology more than shrinking the bilateral trade deficit. In response to that, Chinese onshore technology stocks tended to suffer more than the overall market shortly after news related to U.S.-China friction.

If friction between the U.S. and China continues to persist, foreign companies may reduce their supply chain reliance on China, and the slowing pace of technology transfer from foreign countries in the production process in China may also hurt China-based companies’ competitiveness over time. However, S&P Global Rating’s recent comment, “Decamping Factories Unlikely To Unplug China’s Growth Advantage,” suggested many foreign manufacturers are also likely to continue investing in China due to the fast-growing domestic market. Equity prices seemed to align with this view, as we did not see significant underperformance in Technology Hardware stocks and saw outperformance in Semiconductors stocks in China since the beginning of this year.

References:

The Essential Podcast, Episode 11: A View to the Future – China Beyond the Pandemic, Priscilla Luk and Nathan Hunt, S&P Global (May 29, 2020)

How the Chinese Equity Market Responded to the Domestic and Global Coronavirus Outbreak, Priscilla Luk, S&P Dow Jones Indices (April 5, 2020)

An Unlikely Stabilizer in Emerging Markets, John Welling, S&P Dow Jones Indices (Apr 3, 2020)

A Great New Game—China, the U.S. and Technology, The China Senior Analyst Group, S&P Global (May 14, 2019)

Decamping Factories Unlikely To Unplug China’s Growth Advantage, KimEng Tan & Rain Yin, S&P Global Ratings (May 21, 2020)

The posts on this blog are opinions, not advice. Please read our Disclaimers.