Get Indexology® Blog updates via email.

In This List

Taking Stock Of U.S. Equities In 2018

New All-Time Record - Open Interest for Cboe S&P 500 Options Surpasses 21 Million Contracts

Changes in India’s Investment Sphere – An Overview of 2018

Recession Chatter

REITs: A Rare Bright Spot in an Otherwise Difficult Year for Canadian Equities

Taking Stock Of U.S. Equities In 2018

Contributor Image
Jodie Gunzberg

Former Managing Director, Head of U.S. Equities

S&P Dow Jones Indices

As the year comes to a close with just two trading days left of the second worst December on record since 1931 for the S&P 500, it may be hard to remember the relatively calm rise before the volatile downturn took over.  Though there is not an official bear market yet, there was a 19.8% drop by the end of Christmas Eve that rebounded nearly 5% on the day following Christmas (Dec. 26, 2018.)  The decline can be blamed on a number of different factors including slowing economic growth in China and Europe, ongoing political uncertainty and turmoil both domestically and abroad, a softening housing market, as well as Fed tightening and businesses facing a tighter credit environment.

Now, every single sector, style and size of the market are down this month, which has only ever happened in 9 other months in history.   While 6 of those months have come in pairs, the Januaries following Decembers of years this bad are slightly positive, up 11 of 20 times, averaging 65 basis points with positive years in 13 of 20 times with an average return of 4.2%.  As discussed in this post, the first few days of a rebound is key for investors, so don’t miss it – and historically, mid-caps and small caps typically do much better in rebounds than large caps.  There are some bright spots as the economy is still growing, the labor market is tight and consumer spending is healthy with contained debt levels.

To end the year, here is a list of some of the most popular U.S. equity market topics for 2018, including the telecommunication services sector expansion into communication services, small caps, rising interest rates and the signal that warned of this near bear market.

Sectors

A First Look Inside The Communication Services Select Sector Index
Before & After The Sector Shakeup In The S&P 500 – Part 2
Before & After The Sector Shakeup In The S&P 500 – Part 1
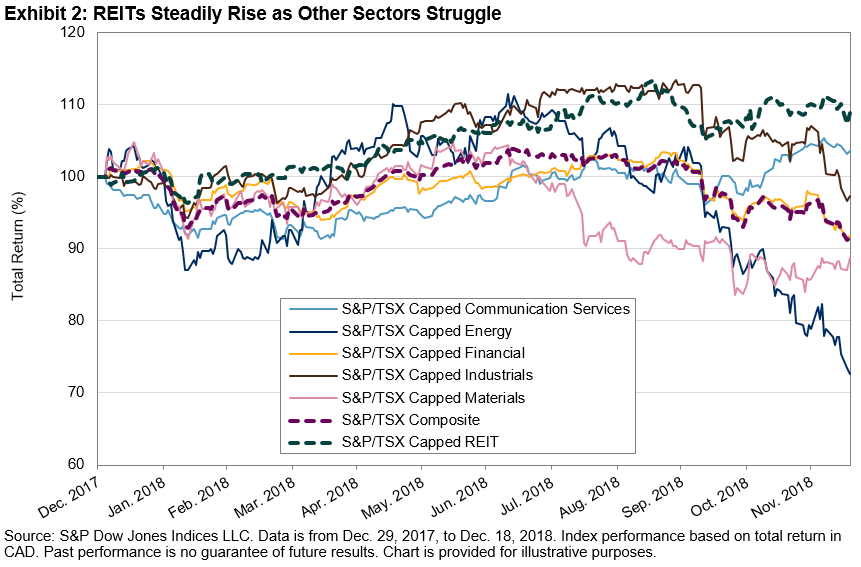
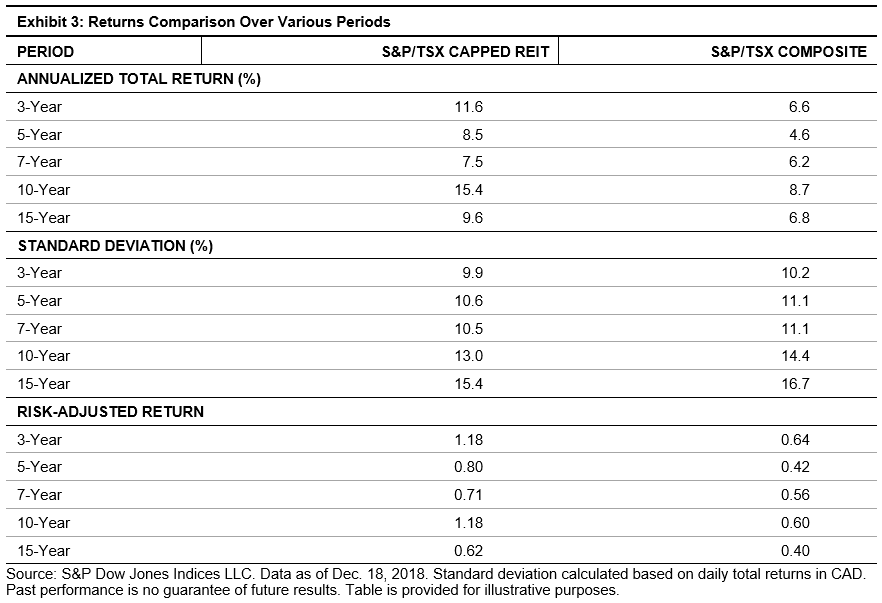
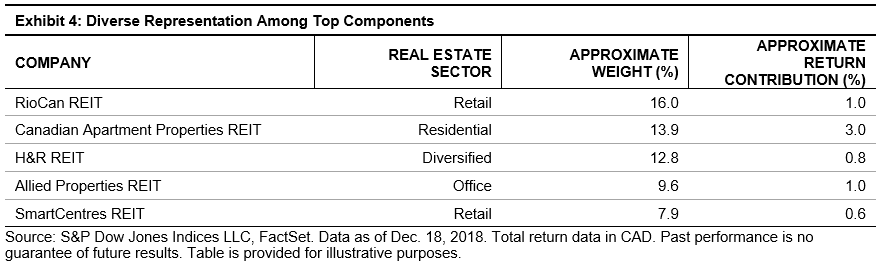
What’s In A Sector?
Drilling Into Industries Finds What Lifts Energy Stocks With Oil
Capturing Global Market Gains Using U.S. Sectors

Small Caps

Small Cap Premium Is 5th Biggest In History
One Big Problem In July For One Small Cap Index
Big Things Come In Small Packages – Part 1
Growth Is Still Hot Only In Small Caps
There’s Nothing Equal About Equal Weight Returns

Market Downturn

Bearish Divergence May Signal Stock Market Warning
Stocks On Pace For The 6th Scariest October Ever

Interest Rates, The Dollar

3 Reasons To Love Equities When Rates Are Rising
Here’s Why Mid-Caps Matter As The Dollar Drops

Happy holidays to all and thank you for reading our Indexology Blog.  Please let us know in the comments if you have any topics you want to discuss or if you have any questions.

The posts on this blog are opinions, not advice. Please read our Disclaimers.

New All-Time Record - Open Interest for Cboe S&P 500 Options Surpasses 21 Million Contracts

Contributor Image
Matt Moran

Head of Index Insights

Cboe Global Markets

While many investors are concerned about the fact that benchmark indexes for major investment classes are down year-to date, more investors are using S&P 500® options for goals related to risk management and income enhancement.

  • On December 20 open interest for Cboe S&P 500 (SPX(SM) and SPXW) options surpassed 21 million for the first time ever in its history of more than 35 years, and hit a new all-time record high of 21,424,148 contracts, and
  • The Cboe S&P 500 95-10 Collar Index (CLLSM), an index that tracks the performance of a strategy that buys SPX puts for protection and sells SPX calls for income, rose 2% in 2018 (through December 20).

CHARTS ON RECORD OPEN INTEREST FOR S&P 500 OPTIONS

The chart below shows that open interest for Cboe’s S&P 500 options rose from 1.1 million in 1993, to 16 million in July 2018, to a record 21.4 million contracts on December 20.

RECENT COMMENTS FROM TRADERS AND PORTFOLIO MANAGERS

In the past week I spoke with a number of traders and portfolio managers to inquire about their thoughts about the growth to record open interest in S&P options. The responses I heard included –

  • “Higher volatility levels in recent months make the markets more attractive for options sellers who wish to generate more premium.”
  • “Cash-secured put-writing has gained more mainstream acceptance”
  • “There is more interest in portfolio protection and generation of income”
  • “There is more trading in SPX call spreads. Look at SPX call open interest which has been beefed up by the sheer quantity of multi-legged call trades that have been trading to hedge the other tail. Millions of calls since the Sept 21st expiry!”
  • “We are seeing SPX volatility sellers with some big multi-leg positions”

YEAR-TO-DATE PERFORMANCE AND MITIGATION OF LOSSES WITH CLL INDEX

The chart below shows that “traditional” key benchmark indexes for large-cap US stocks, small-cap US stocks, emerging markets stocks, Treasury bonds and commodities all fell in 2018 (through December 20), but that the Cboe CLL index rose 2% in the same time period.

The Cboe S&P 500 95-10 Collar Index (CLL) is an index designed to provide investors with insights as to how one might protect an investment in S&P 500 stocks against steep market declines. This strategy accepts a ceiling or cap on S&P 500 gains in return for a floor on S&P 500 losses. The passive collar strategy reflected by the index entails:

  • Holding the stocks in the S&P 500;
  • Buying three-month S&P 500 (SPX) put options to protect this S&P 500 portfolio from market decreases; and
  • Selling one-month S&P 500 (SPX) call options to help finance the cost of the put options.

The term “95-110” is used to describe the CLL Index because (1) the three-month put options are purchased at a strike price that is about 95 percent of the value of the S&P 500 at the time of the purchase (in other words, the puts are about five percent out-of-the-money), and (2) the one-month call options are written at a strike price that is about 110 percent of the value of the S&P 500 at the time of the sale (in other words, the calls are about ten percent out-of-the-money). The starting and base date for CLL Index is June 30, 1986, at which it was priced at 100. The CLL Index is designed to be a valuable resource for investors who want to explore ways to manage their portfolio risk in bear markets.

SPX SKEW CHART SHOWS HIGHER IMPLIED VOLATILITY FOR OTM PUTS

The volatility skew chart below shows estimates for implied volatility (y-axis) for S&P 500 options for the Monday, Wednesday and Friday expirations (dates in legend at left) and at various strike prices (in x-axis). Note that the implied volatility estimates for many of the out-of-the-money (OTM) S&P 500 put options range from 22 to 110, while the implied volatility estimates for many of the S&P 500 call options range from 15 to 40, a much lower range. One could infer from this chart that there probably is quite a bit of strong demand for downside protection with use of the OTM puts. In addition, in recent years many investors have seen the performance of the Cboe S&P 500 PutWrite Index (PUT) and become more comfortable with the idea of selling cash-secured puts on the S&P 500.

MORE INFORMATION

To learn more about ways in which index options and volatility products can be used in portfolio management, please visit these links –

++++++++++++++++++++++++++

Options involve risk and are not suitable for all investors. Prior to buying or selling an option, a person must receive a copy of Characteristics and Risks of Standardized Options (ODD). Copies of the ODD are available from your broker or from The Options Clearing Corporation, 125 S. Franklin Street, Suite 1200, Chicago, IL 60606. The information in this blog is provided solely for general education and information purposes and therefore should not be considered complete, precise, or current.  Many of the matters discussed are subject to detailed rules, regulations, and statutory provisions which should be referred to for additional detail and are subject to changes that may not be reflected in these materials. No statement within this material should be construed as a recommendation to buy or sell a security or to provide investment advice.  The Cboe S&P 500 BuyWrite Index (BXMSM), BXMDSM Index, PUTSM Index, and CLLSM Index are designed to hypothetical strategies that invest in index options and/or VIX futures Like many passive benchmarks, the Indexes do not take into account significant factors such as transaction costs and taxes. Transaction costs and taxes for an options-based strategy could be significantly higher than transaction costs for a passive strategy of buying-and-holding stocks. Investors attempting to replicate the Indexes should discuss with their brokers possible timing and liquidity issues. Past performance does not guarantee future results. These materials contain comparisons, assertions, and conclusions regarding the performance of indexes based on backtesting, i.e., calculations of how the indexes might have performed in the past if they had existed. Backtested performance information is purely hypothetical and is provided in this document solely for informational purposes. The methodology of the Indexes is owned by Cboe, Incorporated (Cboe) may be covered by one or more patents or pending patent applications. S&P®, and S&P 500® are registered trademarks of Standard & Poor’s Financial Services, LLC and are licensed for use by Cboe, Incorporated (Cboe) and Cboe Futures Exchange, LLC (CFE). Cboe’s financial products based on S&P indices are not sponsored, endorsed, sold or promoted by S&P and S&P makes no representation regarding the advisability of investing in such products. Cboe Volatility Index®, VIX®, Cboe® and Chicago Board Options Exchange® are registered trademarks of Cboe. All other trademarks and service marks are the property of their respective owners.

The posts on this blog are opinions, not advice. Please read our Disclaimers.

Changes in India’s Investment Sphere – An Overview of 2018

Contributor Image
Koel Ghosh

Former Head of South Asia

S&P Dow Jones Indices

“Change is the only constant,” as quoted by Heraclitus, a Greek philosopher.

The recent assembly election results have reiterated this. We saw a leadership change at the Reserve Bank of India (RBI), with Mr. Shaktikanta Das’s appointment as the new RBI Governor, following Mr. Urjit Patel’s resignation.

The financial markets have also had their fair share of ups and downs. In 2018, India’s equity market witnessed a low when the S&P BSE SENSEX dropped to 32,596 (price return index level as of March 23, 2018), but also saw a high of 38,896 (price return index level as of Aug. 28, 2018)—a fluctuation of 6,300 points and a 19% variation over the year. However, this year the index reached record highs compared with the past 10 years. The S&P BSE SENSEX first crossed the 10,000 mark on Dec. 18, 2008, the 20,000 mark on Sept. 21, 2010, and finally the 30,000 mark on April 26, 2017. The fixed income market was no exception, with the 10-year Government Bond yields crossing 8% multiple times in September and October 2018. There has a been an ongoing discussion on the broadening of the Indian debt market, which faces challenges in terms of liquidity, innovation, investor awareness, and participation.

Other changes introduced by the Securities and Exchange Board of India (SEBI) were style and size definitions for mutual funds, as well as consolidation of  mutual fund schemes to a single offering in each style category in order to create a standardization for the market and its investors. SEBI also advised mutual funds to adopt total return indices (TRI) to benchmark their schemes, effective as of Feb. 1, 2018. This would enable investors to compare the appropriate index with the scheme’s performance.

With the constantly shifting investment landscape, some changes have been significant. The endless discussion around the active vs. passive debate has also progressed. More and more market participants have aligned with the fact that a passive investment strategy can be part of the overall investment goal achievement. A core satellite strategy easily encompasses both active and passive styles. The SPIVA® India Mid-Year 2018 results revealed how large-cap funds in India have been under performing the benchmark, the S&P BSE 100. The index outperformed the fund category by over 87% in the 1-year period, 78% in the 3-year period, 48% in the 5-year period, and 62% in the 10-year period. Active fund managers have been waking up to the fact that large-cap passive investing is a strategy potentially worth evaluating.

Exhibit 2: Percentage of Funds Outperformed by the Index
FUND CATEGORY COMPARISON INDEX 1-YEAR (%) 3-YEAR (%) 5-YEAR (%) 10-YEAR (%)
Indian Equity Large-Cap S&P BSE 100 87.88 78.35 48.08 62.77
Indian Equity-Linked Savings Scheme S&P BSE 200 83.72 61.54 27.78 43.33
Indian Equity Mid-/Small-Cap S&P BSE 400 MidSmallCap Index 62.22 78.26 53.03 50.67
Indian Government Bond S&P BSE India Government Bond Index 82.93 75.47 82.35 94.92
Indian Composite Bond S&P BSE India Bond Index 30.00 60.42 68.70 95.45

Source: S&P Dow Jones Indices LLC, Morningstar, and Association of Mutual Funds in India. Data as of June 30, 2018. Past performance is no guarantee of future results. Table is provided for illustrative purposes and reflects hypothetical historical performance. The S&P BSE 400 MidSmallCap Index was launched on Nov. 30, 2017. The S&P BSE India Government Bond Index was launched on Dec. 31, 2013. The S&P BSE India Bond Index was launched on March 12, 2014. .

Furthermore, government bodies like the Employee Provident Fund Organization (EPFO) and the Department of Investment and Public Asset Management (DIPAM) have supported the passive style of investing with the promotion of exchange-traded funds (ETFs). EPFO’s allocation to equity ETFs stood at 15% of its investible surplus, which is over INR 40,000 crores as of September 2018. Furthermore, the EPFO has been developing software that will allow them to credit the ETFs to subscriber accounts, thereby empowering subscribers for further transaction. DIPAM, on the other hand, used the ETF vehicle successively to liquidate holdings in public sector undertakings. In 2018, they had follow on offers for the ETFs, the S&P BSE BHARAT 22 ETF and the CPSE ETF, both of which were oversubscribed. Their new initiative for a debt ETF could be a strong innovation to promote passive style of investing in the fixed income space.

Passive investing is now getting more emphasis, and as index-based investing offers diversification, transparency, and liquidity, there are positive signals that with growing investor education and awareness, India could witness more growth in the days to come.

References:

The posts on this blog are opinions, not advice. Please read our Disclaimers.

Recession Chatter

Contributor Image
David Blitzer

Former Managing Director and Chairman of the Index Committee

S&P Dow Jones Indices

Inspired, or worried, by the stock market there is more and more talk of a recession in 2019.

To look past the usual comment that the stock market predicted nine of the last five recessions, a short list of positive and negative signals:

Why There Won’t be an Early Recession

  • Economy has momentum, growing faster than its potential now
  • Employment, wages rising; unemployment rate low
  • Consumer debt levels and defaults not a problem
  • Consumer spending increasing
  • Interest rates and inflation are low

Why There Will be an Early Recession

  • China, European economic growth slowing
  • Sales of New and existing homes falling
  • Turmoil in Washington
  • Fed is tightening
  • Business facing tighter credit

Economic expansions don’t die of old age. Changing economic conditions lead investors, consumers and business to cut spending, hunker down and hoard cash. What conditions? Sharply higher interest rates, bankruptcies and defaults, collapsing economies in other countries or large natural disasters. The second list isn’t that grim.

What can one conclude? The economy in 2019 is likely to grow more slowly and not feel as good as in 2017 or 2018. Secondly, if the negative factors don’t vanish or shrink a lot, there will be a recession, though it is not clear when.

The posts on this blog are opinions, not advice. Please read our Disclaimers.

REITs: A Rare Bright Spot in an Otherwise Difficult Year for Canadian Equities

Contributor Image
John Welling

Director, Global Equity Indices

S&P Dow Jones Indices

Despite weak Canadian equity market returns this year, REITs have continued their long-term outperformance. The benchmark S&P/TSX Composite has fallen 8.5% on a total return basis through Dec. 18, 2018, while the S&P/TSX Capped REIT continues to be a bright spot, gaining 8.8% over the same period—a difference of over 17%.

Market analysts tend to point to rising interest rates as a potential threat to equity REIT valuations. Though prior research[1] has shown this to be a misconception, a common assertion is that REITs are destined to underperform when interest rates rise. The Bank of Canada has raised rates three times in 2018—in January, July, and October, while Canada 10-Year Benchmark bond yields have been unpredictable throughout the year. Canada REIT performance appears to have little to do with the current rate environment; in fact, Canadian REITs have been on a steady rise, particularly in comparison with the largest S&P/TSX Composite sectors as depicted in Exhibit 2.

The outperformance phenomenon further extends across the most recent 3-, 5-, 7-, 10-, and 15-year periods, demonstrating consistently higher returns and lower risk over longer periods when compared to broad Canadian equities.

As of Dec. 18, 2018, the S&P/TSX Capped REIT included 16 constituents. Exhibit 4 shows the five largest components along with estimated contribution figures to the 8.8% YTD total return of the index.

Conclusion

REITs have enjoyed strong returns amid a bumpy Canadian equity market in 2018. While the recent contrast in performance is particularly pronounced, consistently higher returns and lower volatility of the S&P/TSX Capped REIT over longer periods demonstrates strong underlying fundamentals of Canadian REITs.

[1] Orzano, Michael and Welling, John, “The Impact of Rising Interest Rates on REITs,” S&P Dow Jones Indices.

The posts on this blog are opinions, not advice. Please read our Disclaimers.