Get Indexology® Blog updates via email.

In This List

Stocks On Pace For The 6th Scariest October Ever

Introducing the S&P BSE Diversified Financials Revenue Growth Index

Outperformance in South Africa and Avoiding Single-Stock Risk

Leveraged Loans in a Rising Rate Environment – Carry Factor Dominates

Bonding with Defensive Equity Strategies

Stocks On Pace For The 6th Scariest October Ever

Contributor Image
Jodie Gunzberg

Former Managing Director, Head of U.S. Equities

S&P Dow Jones Indices

The S&P 500 is down 9.4% month-to-date as of the close on Oct. 29, 2018, and is on pace to record its worst Oct. since 2008 and its sixth worst Oct. based on history since 1928.  The other years when the S&P 500 that lost more in Oct. than in Oct. 2018 (so far) happened in 1987, 1929, 2008, 1932, 1937.

Source: S&P Dow Jones Indices.

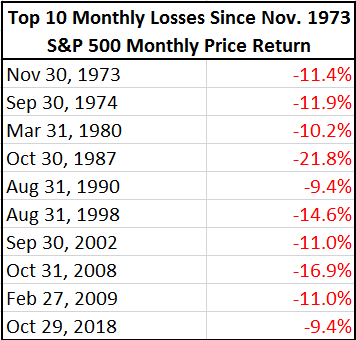
Also, month-to-date, the S&P 500 is having its 34th worst month on record and its worst month since Feb. 2009, when it lost 11.0%.  The top ten worst months in S&P 500 history in chronological order date back to Nov. 1973, nearly 45 years ago, when the S&P 500 lost 11.4%, the most in 26 years, since Nov. 1948, when it lost 10.8%.

Source: S&P Dow Jones Indices.

Not only is the S&P 500 having a historically bad month but almost all slices of U.S. equities by size, sector and style are losing big too.  Month-to-date, of every style, size and sector, only large cap consumer staples and utilities are positive, up 1.0% and 2.8%, respectively.  Energy was the worst performing sector across the sizes, losing 13.8%, 19.1% and 21.7% in large-, mid-, and small-caps, respectively, as the S&P GSCI (WTI) Crude Oil lost 8.5% month-to-date (through Oct. 29, 2018).

Source: S&P Dow Jones Indices.

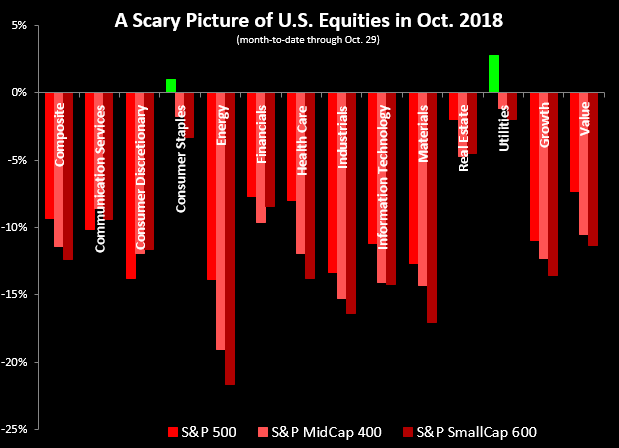
The losses are historically big when evaluating the sectors, sizes and styles as well.  This is the 3rd worst month in history for S&P 500 Consumer DiscretionaryS&P 500 EnergyS&P 500 Industrials and S&P 600 Industrials, losing a respective -13.8%, -13.8%, -13.3% and -16.4% (month-to-date through Oct. 29, 2018,) all on pace to post their 2nd worst Oct. in history.  Additionally, there are a total 30 of 42 slices by the composites, sectors, sizes and styles that are on track to post their 2nd worst Oct., and all of them are having one of their top 20 worst months ever – with 13 indices on pace to have their 5th, 4th or 3rd worst ranked months ever.

S&P 500 is from Sep. 1989 and sectors data is from Oct. 1989, except Real Estate is from Nov. 2001, S&P 500 Growth and S&P 500 Value are from Feb. 1994. S&P 400 data is from Jan. 1991 and sectors data is from Jan. 1995, except Real Estate is from Nov. 2001, S&P 400 Growth and S&P 400 Value are from 1998. S&P 600 data is from Jan. 1994 and sectors data is from Jan. 1995, except Real Estate is from Nov. 2001, S&P 600 Growth and S&P 600 Value are from Apr. 1997. All Data ending Oct. 29, 2018. Index data is Price Return.

In the past, the S&P 500 lost in all the Nov. months following the most losing Oct.’s.  The Nov. returns of the S&P 500 in 1987, 1929, 2008, 1932, 1937 were -8.5%, -13.4%, -7.5%, -5.9% and -10.1%, respectively.  However, in Dec. of each of these years, the S&P 500 was positive except for in 1937 when the index lost an additional 5.0% before bouncing back in Jan. 1938.

There have been some concerns about signs of economic weakness recently including lower than expected inflation, soft housingflat auto sales, plus a slightly decelerating GDP and growing concerns over trade tensions, so analysts may be watching these factors as well as how the Fed raises rates – or not.   Many may be looking for value opportunities as stocks have fallen and value is outperforming growth by the most since Nov. 2016 in large- and mid-caps, and the most since Mar. 2016 in small-caps with respective value premiums of 3.6%, 1.7% and 2.3%.
.


The posts on this blog are opinions, not advice. Please read our Disclaimers.

Introducing the S&P BSE Diversified Financials Revenue Growth Index

Contributor Image
Mahavir Kaswa

Former Associate Director, Product Management

S&P BSE Indices

During the first half of 2018, Asia Index Private Limited launched the S&P BSE Diversified Financials Revenue Growth Index. It is the first index of its kind in India, and it seeks to measure the performance of private (non-state-owned) stocks from the S&P BSE 500 in the finance sector. The index includes the top three quartiles from the eligible universe based on revenue growth criteria as defined in the index methodology.[1] The index is a variable count index; it had 48 constituents as of Sept. 29, 2018. It covers approximately 70% of the S&P BSE Finance in terms of total market capitalization. It is reconstituted semiannually in June and December.

The index offers a diversified exposure to various sub-industries of the BSE Finance sector. As shown in Exhibit 1, the index basket includes 9 banks out of the 38 banks that are part of the S&P BSE Finance. The largest sub-industry in the index is Banks, with a total weight of 30.2% as compared to 63% in the S&P BSE Finance.

As defined in the index methodology, the maximum weight of stocks in the index is capped at 5% with quarterly weight resets. The top 10 stocks in the index account for a total weight of 49.2% as compared to 77.6% in the S&P BSE Finance. As illustrated in Exhibit 2, large cap accounts for a total weight of 61%, whereas the com   bined weight of large and mid caps in the index is 93.5%.

Index Performance and Risk/Return Profile

As shown in Exhibit 3, over the past 10 years, the S&P BSE Diversified Financials Revenue Growth Index outperformed the S&P BSE Finance and the S&P BSE 500 by a considerable margin.

As depicted in Exhibit 4, the S&P BSE Diversified Financials Revenue Growth Index outperformed the S&P BSE Finance and S&P BSE 500 over the 3-, 5-, and 10-year periods studied. Although the index noted higher volatility, the index also noted higher risk-adjusted returns during the same periods.


[1] http://www.asiaindex.co.in/documents/methodology/methodology-sp-bse-allcap.pdf

The posts on this blog are opinions, not advice. Please read our Disclaimers.

Outperformance in South Africa and Avoiding Single-Stock Risk

Contributor Image
John Welling

Director, Global Equity Indices

S&P Dow Jones Indices

The returns of two liquid equity benchmarks in South Africa with the same target market have been significantly different YTD as of Oct. 26, 2018. Over the period, the S&P South Africa 50 has declined 8.8% while the FTSE/JSE Top 40 has fallen 12.6%—a difference of over 380 bps—a considerable performance gap over a fairly short period of time. This difference may be explained by idiosyncratic risk and a single component included in each index.

Idiosyncratic Risk Can Hurt Performance

Idiosyncratic risk occurs when a single stock or asset drives portfolio performance for reasons apart from macroeconomic forces. Stocks often underperform, can free fall due to scandal, and may even declare bankruptcy. The opposite may be true on the upside, when company valuations gain by multiples over relatively short periods of time. However, in a well-diversified portfolio, the effect of these moves are typically contained due to the offsetting performance of other assets. In the case of the FTSE/JSE Top 40, however, there is one stock—Naspers—that has largely driven the direction of the index YTD.

Naspers Moves an Index

Naspers forms approximately 20% of the FTSE/JSE Top 40, whereas in the S&P South Africa 50, the stock weight forms half of that—about 10%.[i] Naspers owns a 31.1% share of Tencent, and while its share value has dropped 36% YTD, indices (and portfolios) with outsized exposures to Naspers have suffered as a consequence. Exhibit 1 illustrates the YTD performance of each index alongside the performance of Naspers and Tencent. The exhibit shows that large single-stock exposure has been a driving force behind the varied performance of the two indices.

Capping Mitigates Single-Stock Risk

Capping is not a new concept for indices and can potentially be a way to avoid outsized single-stock exposure. For the S&P South Africa 50, each stock is limited to a 10% single-stock cap, which is applied quarterly in order to enhance diversification and meet the needs of market participants who are subject to regulatory requirements regarding single-stock concentration. The result is that in the S&P South Africa 50, the top three stocks compose roughly 30% of the index. In contrast, the same three stocks make up over 42% of the FTSE/JSE Top 40’s weight.[ii] The inclusion of 10 additional stocks in the S&P South Africa 50 likewise helps to further diversify the index and spread out risk across 25% more companies.

Conclusion

While the recent decline of Naspers highlights the potential benefits of greater diversification in the S&P South Africa 50, the improved performance is not limited to recent history. Exhibit 2 shows that the benefits of diversification have historically led to greater total returns, lower risk, and therefore improved risk-adjusted returns across the examined periods.

[i] Figures as of Sept. 28, 2018.

[ii] Figures as of Sept. 28, 2018.

The posts on this blog are opinions, not advice. Please read our Disclaimers.

Leveraged Loans in a Rising Rate Environment – Carry Factor Dominates

Contributor Image
Hong Xie

Former Senior Director, Global Research & Design

S&P Dow Jones Indices

Since the end of 2015, the U.S. Federal Reserve has raised the policy rate eight times to currently 2.0%-2.25%. The minutes of the recent September FOMC meeting reiterated the committee’s positive growth outlook and confidence on 2% inflation. Market players continued to catch up on pricing future Fed hikes. Currently the market is implying approximately one more hike in 2018 and two more in 2019.

With expectations of higher rates ahead, leveraged loans remain highly attractive for market participants, due to their feature of coupon reset at a spread over a floating index (mostly the three-month LIBOR rate). In addition, leveraged loans generally provide higher protection than traditional high-yield bonds, since the loans are secured with collateral.  Against that backdrop, we show a few salient characteristics of the S&P/LSTA U.S. Leveraged Loan 100 Index to provide additional color for this segment.

Exhibit 1 compares total and price returns for the index since January 2002 (the index inception). Except during the global financial crisis of 2008-2009, the price return of the index has been stable and flat. In an orderly market, loans don’t provide much price appreciation due to the combination of floating LIBOR rate, lack of call protection, and possible refinancing at lower spreads. However, the index delivered a cumulative 113% on a total return basis over the same period. The figure demonstrates that carry is the dominating source of return historically for leveraged loans over mid- to long-term investment horizons.

Exhibit 2 shows the index yield[1] against the three-month LIBOR and the index’s average LIBOR spread. Though the spreads for loans have decreased since 2016, rising LIBOR rates have more than offset the spread narrowing and have pushed index yield to increase since 2017. The lower loan spreads also partially reflect the improving credit quality of the loan index (see Exhibit 3).

Against the macroeconomic backdrop of future rate hikes and tighter monetary policy, it is not difficult to see why leveraged loans are popular among market participants in search of a protective cushion against rising rates. Our analysis shows that it is important to pay close attention to the yield/carry level of this segment.

[1] Yield for loans is calculated with current coupon adjusted for price discount/premium.

The posts on this blog are opinions, not advice. Please read our Disclaimers.

Bonding with Defensive Equity Strategies

Contributor Image
Fei Mei Chan

Former Director, Core Product Management

S&P Dow Jones Indices

“The aim of the wise is not to secure pleasure, but to avoid pain.”

– Aristotle

Recent volatility in equity markets may be unsettling to some investors. Skittishness about the stock market is understandable, especially in the context of the serenity in 2017. Volatility levels are relatively higher and risk is on the radar of investors’ consciousness again.

Historically, bonds have been the preferred asset class in times of turmoil. The bull market for bonds in the last 30+ plus years meant the tradeoff in returns wasn’t that much of a sacrifice. But, as the chart below shows, at current interest rate levels, bonds as a means of defense are less attractive than they’ve typically been.

In this context, we looked at defensive equity strategies as a means of lowering overall portfolio risk. The S&P 500 Low Volatility Index is the classic example of a risk-reducing strategy; the index tracks the 100 least volatile stocks in the S&P 500.   As the chart below reflects, this index has consistently delivered less volatility than the S&P 500 from 1991 to 2017 on a 10-year rolling basis.  Despite its lower risk profile, the S&P 500 Low Volatility Index has, anomalously, outperformed the S&P 500 in the 27+ years from 1991 to year-to-date 2018.

More recently, during this year’s two major market declines on February 5, 2018 (S&P 500: -4.1%) and October 10, 2018 (S&P 500: -3.3%), the low volatility index also lived up to its objective, outperforming the S&P 500 on both days.  

Low Volatility is perhaps the quintessential defensive equity strategy, but it’s by no means the only one.  Our new paper, Defense Beyond Bonds, provides a deeper discussion of risk-mitigating approaches to equity management.


The posts on this blog are opinions, not advice. Please read our Disclaimers.