Categories
Equities India

Why the S&P 500 Reduces Portfolio Volatility for Indian Investors

Home bias has been a prominent theme in India since the beginning of the mutual fund industry. Investors historically questioned why they should diversify their high GDP growth portfolio (India) with lower growth economies such as the US. This hypothesis has been tested over the last decade. India has delivered a high GDP growth but has fallen short in terms of profitability. The US has had the opposite effect. Despite low GDP growth, profitability has been better than any analyst would have predicted a decade ago.

Investors, as a result, have finally started to realize the importance of geographical diversification. It is a concept well accepted in developed parts of the world, such as the US and Europe, where most investors tend to have globally diversified portfolios.

So global investments have delivered good returns over long-term horizons. What else is there for Indian investors?

Low Correlation with Indian Equities
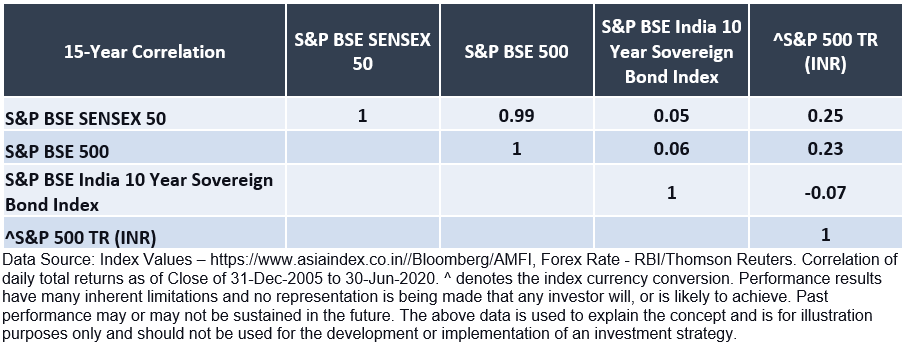
Commonly, investors have invested in multiple equity mutual funds with the hope of diversification. Historically, domestic mutual funds have tended to move in the same direction. Most Indian mutual funds have a correlation of 90%+, giving very little diversification to the investor. Investors in India who are looking to diversify their domestic portfolio tend to accept asset classes with traditionally lower yields such as debt, gold, and real estate.

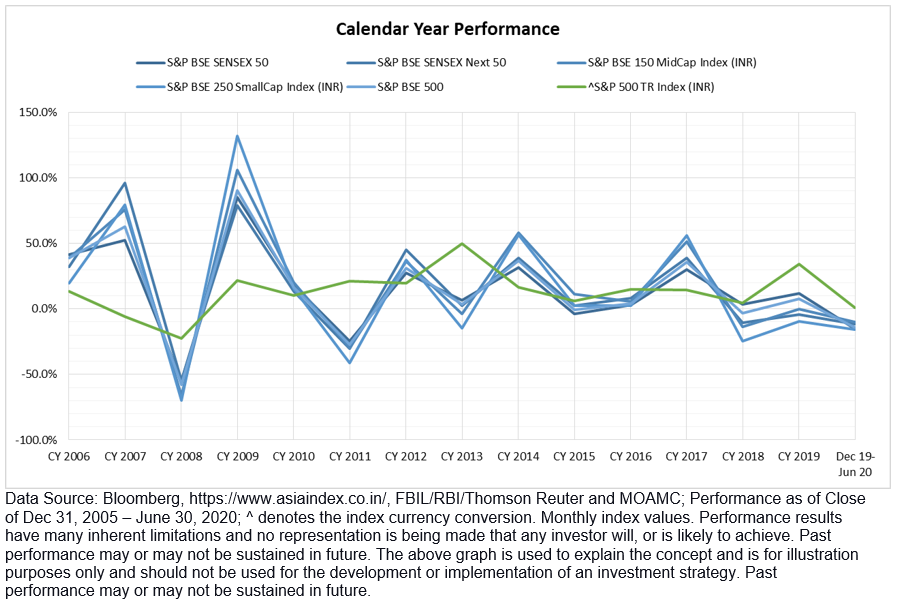
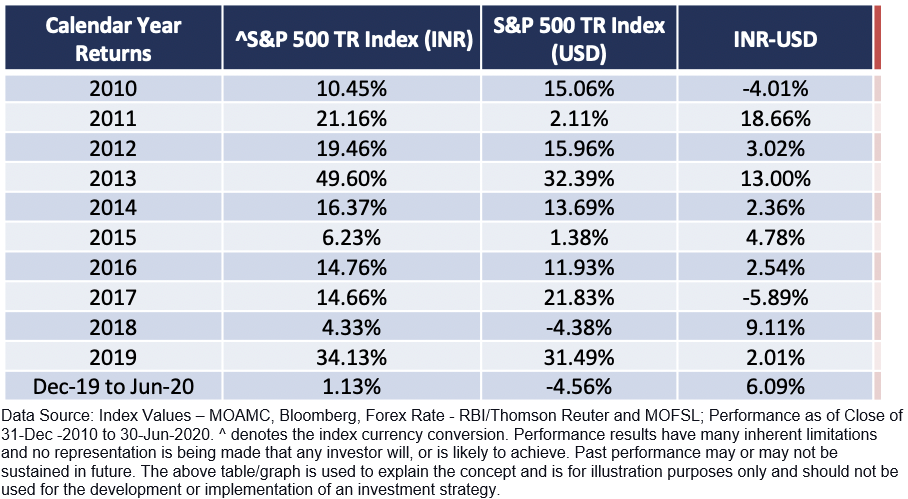
However, international equity is an asset class where investors have experienced equity-like returns and lower volatility due to diversification. The following chart shows calendar returns of the S&P 500 vs. broad-based index funds across categories.

With a lower correlation, investors have seen India and the US deliver good yield returns when combined with lower volatility.
Currency as an Asset Class

The S&P 500 offers Indian investors two asset classes: US Stocks + USD as a currency. With the rupee falling most years (~5% CAGR) over the last ten years, international diversification can potentially give added protection over a falling currency. With investors increasing their spend in USD terms (foreign trips, education, electronics, etc.), it has become attractive to have some wealth invested in dollar-based assets such as the S&P 500.
Higher Dividends and Stock-Level Diversification 

The S&P 500 provides higher dividends in addition to sector-based diversification to Indian investors. India tends to be heavy on financial services, whereby the US tends to have a higher allocation towards Technology and Telecommunications. Access to some of the leading companies with globally diversified revenue streams adds well to the mix of stocks in an Indian investor’s portfolio.

In conclusion, international diversification has taken off partly due to high historical returns over the last decade and partly due to the disappointment in domestic markets. However, diversification is key when considering international investments.
Categories
Equities India S&P 500 & DJIA

Why The S&P 500® Matters in India

We recently held a webinar examining the relevance of the S&P 500 to India-based investors, the potential diversification benefits of incorporating U.S equity exposure to an existing allocation, as well as showing how difficult active managers have found it to beat the index, historically.  You can watch a replay of the webinar here; here are a few highlights.

Having a U.S. view is important for investors around the world.

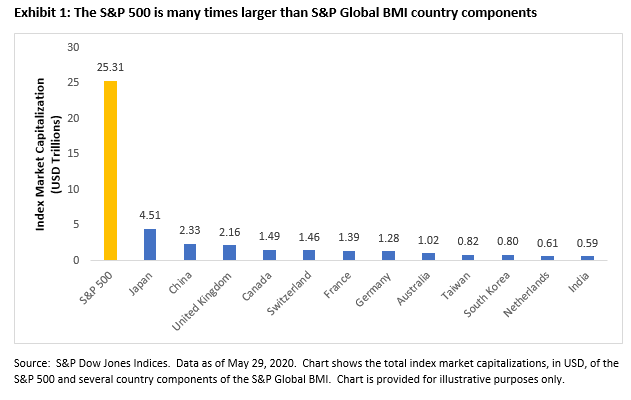
As we have highlighted before, having a U.S. view is vital in a global equity portfolio context.  U.S. companies account for a significant proportion of the global equity market capitalization, therefore trends impacting these companies will be relatively important in driving global equity returns.  For example, the total market capitalization of S&P 500 companies is many multiples larger than other country components of the S&P Global BMI, our global equity benchmark.

Combined with the fact that the S&P 500 accounts for over 80% of the U.S. market, it is perhaps unsurprising that so many people turn to the index to gauge U.S. market performance.  Indeed, our latest Survey of Indexed Assets shows that over USD 11.2 trillion was indexed or benchmarked to the S&P 500 at the end of 2019.

The S&P 500 can help to diversify domestic sector biases.

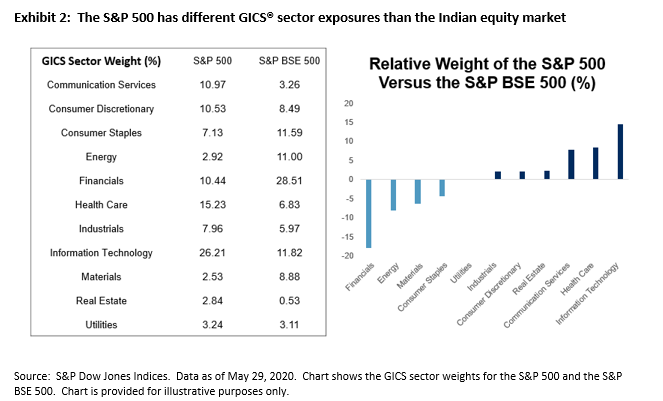
For exposure to certain sectors, Indian investors may find it beneficial to turn to the U.S. – S&P 500 companies accounted for most of index market capitalization in the S&P Global BMI Information Technology, Health Care and Communication Services sectors at the end of May.  Such sizeable representation helps to explain why the S&P 500 has higher weights in these market segments compared to the Indian equity market, as represented by the S&P BSE 500 index.  More broadly, differences in sector breakdowns in the two indices illustrate how the S&P 500 can help to diversify the Indian equity market’s sector biases.

Active managers have struggled to beat the S&P 500, historically.

An important choice for investors is whether to take an index-based approach or to employ an active manager to try and outperform the market. While this debate seems to be evergreen – there are ardent supporters on both sides – S&P Dow Jones Indices publishes semi-annual SPIVA® scorecards to inform the debate.  In particular, SPIVA scorecards compare the performance of active managers against their S&P index benchmarks across multiple regions.

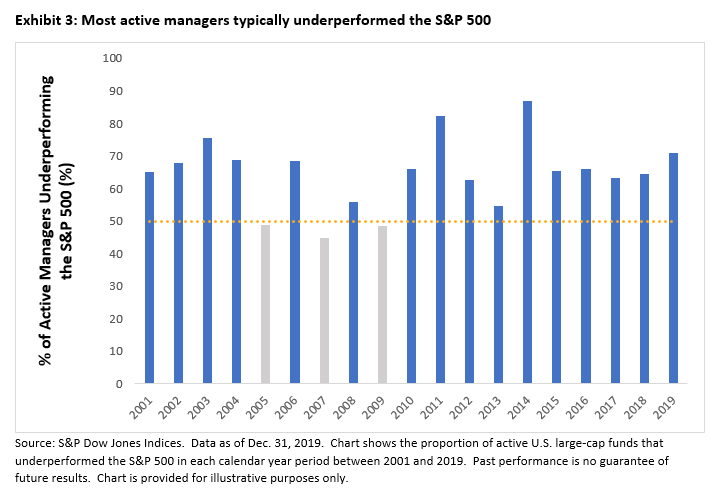
Exhibit 3 shows the majority of large-cap U.S. active managers typically underperformed the S&P 500 since 2001:  the majority of funds underperformed in 16 of the last 19 calendar year periods.  Given this underperformance is frequently observed on a risk-adjusted basis and the start of 2020 offered active managers no place to hide, many may wish to consider the potential benefits of taking an index-based approach.

To sign up for S&P Dow Jones Indices’ scorecards and market commentary, use this link.

Categories
Equities India

Introducing the S&P BSE Diversified Financials Revenue Growth Index

During the first half of 2018, Asia Index Private Limited launched the S&P BSE Diversified Financials Revenue Growth Index. It is the first index of its kind in India, and it seeks to measure the performance of private (non-state-owned) stocks from the S&P BSE 500 in the finance sector. The index includes the top three quartiles from the eligible universe based on revenue growth criteria as defined in the index methodology.[1] The index is a variable count index; it had 48 constituents as of Sept. 29, 2018. It covers approximately 70% of the S&P BSE Finance in terms of total market capitalization. It is reconstituted semiannually in June and December.

The index offers a diversified exposure to various sub-industries of the BSE Finance sector. As shown in Exhibit 1, the index basket includes 9 banks out of the 38 banks that are part of the S&P BSE Finance. The largest sub-industry in the index is Banks, with a total weight of 30.2% as compared to 63% in the S&P BSE Finance.

As defined in the index methodology, the maximum weight of stocks in the index is capped at 5% with quarterly weight resets. The top 10 stocks in the index account for a total weight of 49.2% as compared to 77.6% in the S&P BSE Finance. As illustrated in Exhibit 2, large cap accounts for a total weight of 61%, whereas the com   bined weight of large and mid caps in the index is 93.5%.

Index Performance and Risk/Return Profile

As shown in Exhibit 3, over the past 10 years, the S&P BSE Diversified Financials Revenue Growth Index outperformed the S&P BSE Finance and the S&P BSE 500 by a considerable margin.

As depicted in Exhibit 4, the S&P BSE Diversified Financials Revenue Growth Index outperformed the S&P BSE Finance and S&P BSE 500 over the 3-, 5-, and 10-year periods studied. Although the index noted higher volatility, the index also noted higher risk-adjusted returns during the same periods.


[1] http://www.asiaindex.co.in/documents/methodology/methodology-sp-bse-allcap.pdf

Categories
Equities India

The S&P BSE 500: How Has it Performed?

As highlighted in a prior post, “Getting to Know the S&P BSE 500,” the S&P BSE 500 is considered a proxy for India’s listed equity market, as it covers more than 88% of India’s listed equity universe in terms of total market capitalization. The index also offers diversified exposure to all key sectors of India’s economy and all size segments. In this post, we will review the historical performance of the S&P BSE 500.

As shown in Exhibit 1, from Aug. 1, 2006, to April 30, 2018, the S&P BSE 500 posted an annualized total return of 13.4%, outperforming the S&P BSE 100 and S&P BSE 250 SmallCap Index, while lagging the S&P BSE 150 MidCap Index. The S&P BSE 500 exhibited volatility that was close to the S&P BSE 100’s volatility—not surprising given that S&P BSE 100 constituents account for approximately 79% of the total index weight (see Exhibit 1).

Exhibit 2 shows rolling absolute returns for three-year horizons (750 trading days). All indices compared here performed similarly for most of the period, showing relatively higher correlations with each other. Historically, the S&P BSE 500 and S&P BSE 100 exhibited relatively lower probabilities of negative returns over the three-year investment horizon.

As illustrated in Exhibit 3, out of the total 2,192 trading days observed from Aug 1, 2006, to April 30, 2018, the S&P BSE 500 noted only 113 trading days with returns less than 0%. The relatively more volatile S&P BSE SmallCap 250 Index noted the greatest (452) number of days with negative returns, while the S&P BSE 100, which represents large caps, noted the fewest (52) number of days with negative returns.

Categories
Equities India

Getting to Know the S&P BSE 500

Over the past three to four decades, the Indian equity market has witnessed significant growth, on account of increasing foreign capital flows and participation by domestic institutional investors. The expanding depth and breadth has brought a stronger demand from market participants for suitable benchmarks. The S&P BSE SENSEX launched in 1986 and was the first and most popular Indian benchmark, followed by the S&P BSE 100 and S&P BSE 200 in 1989 and 1994, respectively. In 1999, the S&P BSE 500 was launched in response to market demand for broader benchmarks that offer more complete coverage of the Indian equity market.

The S&P BSE 500 is designed to be a broad representation of the Indian equity market, consisting of the 500 leading companies in terms of total market capitalization that are members of the S&P BSE AllCap. The differential voting rights shares class is eligible to be part of the index, which means that at any point in time, the index will include a fixed number of 500 companies, but the number of stocks in the index could be greater than or equal to 500. The index constituents and sectors are weighted in proportion to their float market capitalization. The index is reviewed semiannually in June and December.

In a recently published paper titled “Measuring Indian Equities: The S&P BSE 500,” we saw that as of April 30, 2018, the S&P BSE 500 represented approximately 88% of all BSE-listed companies, with a total market capitalization of INR 1,35,14,943 crores (approximately USD 2 trillion).

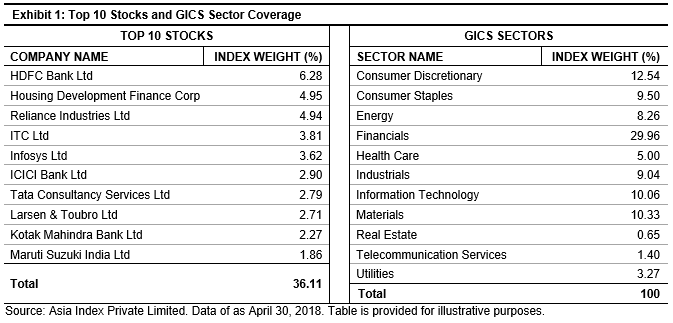
The S&P BSE 500 is diversified across sectors, and no individual sector had an excessive overweight in the index in the period studied. As shown in Exhibit 1, the financials sector had the highest weight in the index, with 30%, followed by consumer discretionary at 12.5%. The services sectors, which include financials, information technology, and telecommunications services, contributed nearly 41% to the total index weight. Also, the combined weight of constituents that have individual derivative contracts was 87%, which facilitates risk management of the index.

Similarly, the S&P BSE 500 offers exposure to all size segments. Large-cap stocks accounted for 79% of the total index weight, mid caps 13%, and small caps 8% as of April 30, 2018 (see Exhibit 2).

With coverage of more than 88% of India’s listed equity universe and diversified exposure to all sizes and all key economic sectors of India’s economy, the S&P BSE 500 seeks to provide comprehensive coverage of the Indian equity market.