The S&P GSCI was up 1.5% for the month and up 8.9% YTD. Precious metals was the worst-performing commodity, while livestock was the best.
Of the 24 commodities tracked by the index, 18 were positive in May. Nickel was the best-performing commodity for the month, while cocoa was the worst.
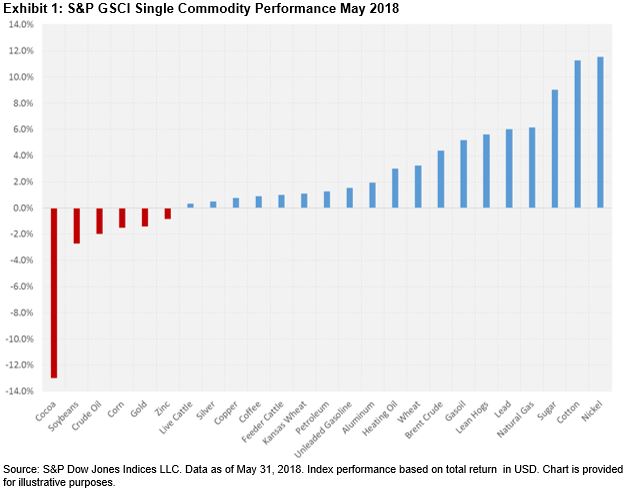
The S&P GSCI Agriculture was up 1.3%. Chicago wheat and Kansas wheat were the best-performing grain commodities, up 3.3% and 1.1%, respectively. Soybeans was the worst-performing grain commodity, down 2.7% for the month, affected by the tariffs imposed by the U.S. on aluminum and steel and the impact this could have on trade with China, which currently imports around 60% of U.S. soybeans, as well as record plantings of the grain in Brazil and the U.S. Cotton was the best-performing softs commodity, up 11.3% for the month and up 18.3% YTD, benefiting from harvest and quality issues, as well as dry weather conditions in the southern plains that could further hinder output.
The S&P GSCI Livestock was up 2.2% for the month. Cattle commodities were positive in May, with feeder cattle up 1.0% and live cattle up 0.3%. Feeder cattle prices were supported by a USDA report that showed a decline in the number of cattle placed on feed in April 2018. Lean hogs was also positive, up 5.6% for the month, due to seasonal demand.
The S&P GSCI Energy was up 1.5%. All the energy commodities, except for WTI crude oil, were positive for the month. Gasoil was the best-performing petroleum commodity, up 5.2% and up 15.0% YTD. WTI crude oil was the worst-performing commodity, down 2.0% over concerns that the Organization of the Petroleum Exporting Countries (OPEC) would raise production levels for the first time since 2016, which further weighed down prices affected by high levels of production. Natural gas was the best-performing commodity in the energy sector, up 6.2%, after the U.S. Energy Information Administration (EIA) reported below average inventory levels combined with high demand during the summer months.
The S&P GSCI Industrial Metals was up 2.1%. All the base metals, except for zinc, were positive in May. Nickel was the best-performing commodity in the sector, up 11.5% due to demand outpacing supply, as nickel is utilized in electronic vehicle batteries, which have seen solid global demand. Zinc was the worst-performing commodity in the sector for the second consecutive month, down 0.8%, bringing its YTD performance to -6.1% due to high supply levels. The S&P GSCI Precious Metals was down 1.2%. Gold fell 1.4%, weighed down by expectations of a moderate increase in inflation levels and rising interest rates, as well as an increase in consumer spending. Silver was up 0.5%, with the benefits from its industrial use outweighing its precious metal safe-haven status.
Exhibit 2 depicts the annualized risk/return characteristics of the S&P GSCI sector and single commodity indices. In terms of annualized returns, the S&P GSCI Livestock was the worst-performing sector in the index, down 13.3%, while the S&P GSCI Energy was the best-performing sector, up 40.6%. Energy also presented the highest level of volatility this past year, with an annualized risk level of 20.9%. Live cattle was the worst-performing commodity, down 17.4% year-over-year, while nickel, the best performer in May, was also the best performer year-over-year, up 73.4%. Natural gas, which declined 12.5% over the past year, presented the highest volatility, with an annualized one-year risk level of 31.4%. Natural gas tended to exhibit the highest level of volatility, as can be seen in its 1%-10% annualized risk levels, due to the impact of weather conditions that affect the fundamentals of supply and demand. Furthermore, natural gas has changed significantly since 2009, with the evolution of new technologies focused on extracting natural gas, which has lowered prices.