The New Year opened with large declines and massive volatility in China’s stock market. According to US press reports, continuing declines in the value of China’s currency, the RMB, are a major factor in the poor performance of the market. While the RMB has slid against the dollar, falling from 6.21/USD at the beginning of 2015 to 6.59/USD on January 7, 2016, a loss of 5.8%, it appreciated when measured against the Australian dollar, the euro and the British pound. China’s currency may be weakening, but that is only part of the FX story – the rest is the strengthening of the US dollar.

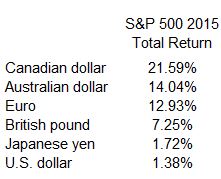
The table shows how the RMB has moved against the dollar, yen, pound, euro and Australian dollar. Since the beginning of last year the RMB fell vs. the dollar and the yen, was roughly flat against the pound and rose against the euro and the Australian dollar. Estimates of trade between China and other countries, reported by the People’s Bank of China in constructing a trade-weighted index of the RMB, show that US traded was 26.4% of the total, euro-denominated trade 21.4%, yen-denominated 14.7%, 6.6% in Hong Kong Dollars and the rest spread across eight other currencies. These figures confirm what the table above shows: the RMB is not universally weaker. Rather, its weakness shows up in about half its trade covering the US, Japan and Hong Kong. With other currencies in other markets, the RMB is stable or appreciating. While exchange rate shifts of 5% to 10% in a year are large, the RMB’s movement cannot explain most of the difficulties facing the Chinese stock market.

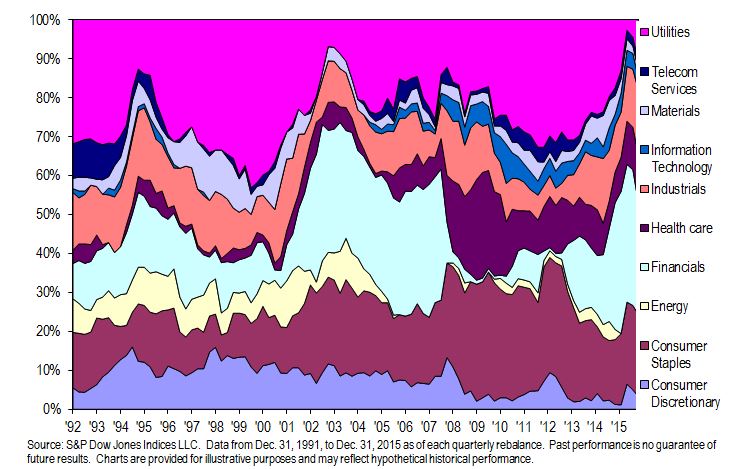
The chart shows the exchange rates measured as indices (RMB per foreign currency) where all indices are based at December 8, 2014 =100. Since higher numbers mean a weaker RMB, the vertical axis is inverted. The Chinese devaluation of August 10-11, 2015 is clear on the chart. The sharp declines in the red and blue lines at the lower right are the weakness against the US dollar and the yen.
The posts on this blog are opinions, not advice. Please read our Disclaimers.