Get Indexology® Blog updates via email.

In This List

The Ruble’s Currency Crisis

Blood in the bourses of Moscow

The Commodity Flip NOT Flop Of 2014

Ouch! Oil Prices Sting Lower Credits, Pushing Yields Lower on Safer Bonds

Inside the S&P 500: The Dividend Aristocrats

The Ruble’s Currency Crisis

Contributor Image
David Blitzer

Former Managing Director and Chairman of the Index Committee

S&P Dow Jones Indices

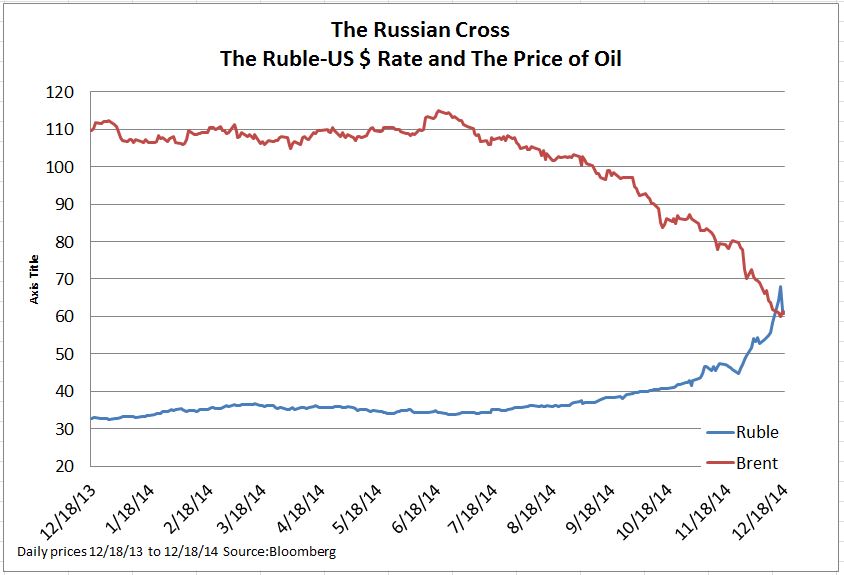
After sliding slowly down for most of the year, The Russian ruble dropped 20% in the last ten days. The slide began with the weakening Russian economy, sanctions imposed by the US and the EU last summer and falling oil prices.  All these factors were present for many weeks and none explain the sharp move seen at the right hand end of the chart where the ruble/dollar rate jumps.

There were two immediate causes. The first, and less important, was a bill passed by Congress authorizing additional sanctions.  While the President signed the bill, no instant action on more sanctions was expected. Second, at the end of last week Rosneft, the Russian oil company, offered a large ruble-denominated bond and the Russian central bank added the new issue to the list of securities it will accept as collateral for loans to local banks. Further, Russian banks were rumored to be the principal purchasers of the Rosneft bonds. Since Rosneft needs to refinance a large US dollar denominated loan from western banks, the markets assumed that, one way or another, the ruble proceeds from the bond issue or rubles from banks using the bonds as collateral with the central bank, would find their way into the foreign exchange markets and put downward pressure on the currency.  These fears sparked the run on the ruble this week.

So far this has played out according to the usual process: gradual economic weakening, rising inflation, large hard currency debts and external pressures on trade (cheap oil) creates nervousness and worry. Then some seemingly minor event like the Rosneft bond issue raises the fear level and leads to a run.

The response also followed the usual script except that for the moment it seems to be successful. First, the Russian central bank raised interest rates by 6.5 percentage points to 17%. Then it followed two days later by intervening in the foreign exchange market and buying rubles. The amount bought isn’t known but Russian foreign exchange reserves, estimated at $200 to $400 billion, don’t appear to be exhausted. Since Wednesday afternoon New York time, the ruble has traded near 60 to the US dollar without any large dips. Brent crude oil, the principal global oil benchmark, is also showing some signs of stability. It rebounded from under $59 yesterday to above $60.  For the moment the combination of relief from collapsing oil prices, the higher interest rates and the forex intervention may be stabilizing the ruble.

If the ruble can remain close to 60, the crisis will be over for the time being and the result will be far better than most past currency crises.  However, no one should assume everything is resolved. Interest rates at 17% and imports 50% more expensive than a year ago (see chart) impose huge stresses on the economy. Add to that the sanctions and the reluctance of European and American businesses to invest in Russian projects, and another currency crisis cannot be ruled out.

Tim Edwards, in an earlier post on this blog, noted that the trailing PE ratio on the S&P Russian BMI is four times, a deliciously low number.  It is either too early or too late: If the ruble holds near 60 or strengthens somewhat it may be too late to speculate in Russia; if the next move takes the Ruble close to 100, it is too early.  Unfortunately there is no way to know.

The posts on this blog are opinions, not advice. Please read our Disclaimers.

Blood in the bourses of Moscow

Contributor Image
Tim Edwards

Managing Director, Index Investment Strategy

S&P Dow Jones Indices

Things are not all well with Russian equities.  The S&P Russia Broad Market Index has lost more than half its value in U.S. dollar terms since the summer.  There is figurative blood on the streets.  If we were to follow the example of the founding members of the Rothschild banking dynasty, we would be lending money to Russian companies and buying up their shares.

The case for investing in Russia now is certainly thought-provoking.  At current prices, the Russian BMI is trading on a trailing price/earnings multiple of around four; the comparable ratio for the Global BMI is closer to twenty.  At roughly 58%, Russian equity volatility is in the 87th percentile of historical readings since 1997 and, to borrow a perspective from our recent whitepaper, periods of high volatility have historically identified beneficial entry points for Russian equities, as the chart shows:

Blood in the bourses

Source: S&P Dow Jones Indices LLC as of December 17th, 2014. Charts and tables are provided for illustrative purposes.  Past performance is no guarantee of future results.

So is Russia a “buy”?

There are two things to bear in mind.  First, somewhat obviously, patience may be required.  Historically, the short-term returns from purchasing at above-average volatility are inferior.   More importantly, the current geopolitical environment would suggest that things are as likely to get worse for Russian equities as they are to get better.

Secondly, the data in the chart above only go back to 1997. There is an obvious risk on relying too much on recent data.  There was no S&P Russia BMI index a hundred years ago, but no doubt if there had been its volatility would have been quite high in 1917; the subsequent destruction of all forms of private capital would provide a counter-example to the general rule of buying at periods of high volatility.

This, of course, is not 1917. Neither is it the turbulent times of the Napoleonic wars that so rewarded the Rothschilds’ historical adventures.  And despite the fact that recent periods of high volatility in Russian equities have represented attractive entry points, that may not imply anything about the current situation.  But historically, in the long term, fortune has favoured the brave, especially (or perhaps exclusively) the patient brave.   This is something to bear in mind as you consider the situation in Russia.

The posts on this blog are opinions, not advice. Please read our Disclaimers.

The Commodity Flip NOT Flop Of 2014

Contributor Image
Jodie Gunzberg

Former Managing Director, Head of U.S. Equities

S&P Dow Jones Indices

Six months ago, commodities looked like they were on the brink of a comeback. The S&P GSCI Total Return gained 7.4% YTD through June 20 at its high.  Back then, almost a record number of commodities, 12, were in backwardation, reflecting shortages in Brent Crude, Cocoa, Copper, Corn, Cotton, WTI Crude Oil, Feeder Cattle, Gold, Live Cattle, Natural Gas, Soybeans and Unleaded Gasoline.

Now, the S&P GSCI TR has lost 1/3 of its value, mostly coming from oil since taken together WTI and Brent make up about 40% of the index with a total of 62% in the energy sector. Energy is down 42.8% from its high in June, and at first it seemed the other sectors were sliding with it. Notice in the table below that in the S&P GSCI TR, all the sectors posted losses from June 20 through most of the summer, with precious metals ending its losing streak just in November.

Source: S&P Dow Jones Indices LLC. All information presented prior to the index launch date is back-tested. Back-tested performance is not actual performance, but is hypothetical. The back-test calculations are based on the same methodology that was in effect when the index was officially launched. Past performance is not a guarantee of future results.  Please see the Performance Disclosure at http://www.spindices.com/regulatory-affairs-disclaimers/ for more information regarding the inherent limitations associated with back-tested performance.
Source: S&P Dow Jones Indices LLC. All information presented prior to the index launch date is back-tested. Back-tested performance is not actual performance, but is hypothetical. The back-test calculations are based on the same methodology that was in effect when the index was officially launched. Past performance is not a guarantee of future results. Please see the Performance Disclosure at http://www.spindices.com/regulatory-affairs-disclaimers/ for more information regarding the inherent limitations associated with back-tested performance.

At some point the oil price slide decoupled from the other commodities since their fundamentals are different. From their respective bottoms, agriculture gained 11.8%, precious metals gained 7.3%, livestock gained 6.0% and industrials metals have been flat, gaining 60 basis points.  Nothing is overpowering Saudi’s oil supply in energy, but now energy seems to be on its own.  Below is the graph of the sector performance where energy’s lonely dropoff is clear.

Source: S&P Dow Jones Indices LLC. All information presented prior to the index launch date is back-tested. Back-tested performance is not actual performance, but is hypothetical. The back-test calculations are based on the same methodology that was in effect when the index was officially launched. Past performance is not a guarantee of future results.  Please see the Performance Disclosure at http://www.spindices.com/regulatory-affairs-disclaimers/ for more information regarding the inherent limitations associated with back-tested performance.
Source: S&P Dow Jones Indices LLC. All information presented prior to the index launch date is back-tested. Back-tested performance is not actual performance, but is hypothetical. The back-test calculations are based on the same methodology that was in effect when the index was officially launched. Past performance is not a guarantee of future results. Please see the Performance Disclosure at http://www.spindices.com/regulatory-affairs-disclaimers/ for more information regarding the inherent limitations associated with back-tested performance.

What’s changing? I have mentioned that low inventories are causing mean reversion that is likely to drive swings between winners and losers. These swings also show up in flipping term structures.  Over the summer through October the number of commodities that remained in backwardation dropped from 12 down to 4. Only WTI, Unleaded Gasoline, Copper and Feeder Cattle remained in backwardation. Today, WTI Crude Oil and Unleaded Gasoline have succumbed to the supply glut of oil so these commodities have lost their backwardated positions and are now in contango.

However, now, in December, the number of commodities that are in backwardation is TEN with six newly flipped commodities! This group includes Feeder Cattle, Heating Oil, Copper, Corn, Cocoa, Silver, Kansas Wheat, Lean Hogs, Coffee and Live Cattle.  News of hoarding from Vietnam of coffee, Russia with wheat and an export tax from India on sugar are supply issues that may be supporting this term structure.


The posts on this blog are opinions, not advice. Please read our Disclaimers.

Ouch! Oil Prices Sting Lower Credits, Pushing Yields Lower on Safer Bonds

Contributor Image
Kevin Horan

Former Director, Fixed Income Indices

S&P Dow Jones Indices

The yield-to-worst of the S&P/BGCantor Current 10 Year U.S. Treasury Bond Index moved down 22 bps last week, to close at 2.09%.  This level of yield has not been seen since June 2013.  The lowest level seen for this index was 1.4% in July 2012.  The index returned 1.49% MTD and 12.33% YTD as of Dec. 12, 2014.

This week, investors will be eyeing any news that comes out of the Fed’s last meeting for the year, which will be wrapping up this Wednesday.  Any indication on the timing of a rate increase could have an effect on the markets and its indices.

With the lack of inflation and an unforeseen drop in oil prices, many investors have recently moved out of stock and into the safety of sovereign and investment-grade bonds.  The “risk-off” move shows that investors are worried about the weakness in the economies of Europe and Japan, leading to concerns of a drag effect on the U.S. economy as well.  With low inflation currently, there is little cause for concern that an increase in inflation would detract from bond investments.

The S&P U.S. Issued Investment Grade Corporate Bond Index has benefitted from the current market environment, as last week’s news turned performance around after a slow start to the month.  As of Dec. 12, 2014, the index has returned 0.24% MTD and 7.75% YTD.  New issuance has been active and price deals are being issued, such as USD 1 billion in three-year paper issued by both American Honda and Goldman Sachs (floating-rate paper).  State Street also issued USD 1 billion, though their deal was for 10-year paper.  The newer fixed-rate paper should enter the index at year-end 2014 if all qualifying conditions are met.

Though still providing yield to portfolios, high-yield bonds have come under fire as the risk-off trades and the drop in oil prices have negatively affected the S&P U.S. Issued High Yield Corporate Bond Index.  As of Dec. 12, 2014, the index is down 2.96% MTD and has only returned 1.04% YTD.  The current YTD return is a far cry from the 5.7% YTD return it had achieved at the end of August 2014.  Energy bonds have been a big drag on the index, as the sector is 15% of the index’s weight.  As of Dec. 12, 2014, the industry sector is down 8.65% MTD and down 9.52% YTD, while excluding energy, the index is down slightly on the month at -1.93% and up 3.21% YTD (see Exhibit 1).

After positive returns for October and November, the S&P/LSTA U.S. Leveraged Loan 100 Index, like the high-yield index, has been knocked off track by recent events.  The index is down 2.06% MTD and has only returned 0.35% YTD as of Dec. 12, 2014.  At this point, the YTD return of 2.6% that was achieved in July is a distant memory.

Exhibit 1: S&P U.S. Issued High Yield Corporate Bond Index Performance
S&P U.S. Issued High Yield Corporate Bond Index Performance


Source: S&P Dow Jones Indices LLC.  Data as of Dec. 12, 2014.  Leverage loan data as of Dec. 14, 2014.  Charts and tables are provided for illustrative purposes.  Past performance is no guarantee of future results.

The posts on this blog are opinions, not advice. Please read our Disclaimers.

Inside the S&P 500: The Dividend Aristocrats

Contributor Image
David Blitzer

Former Managing Director and Chairman of the Index Committee

S&P Dow Jones Indices

Dividends are ever-popular with investors, but owning dividend stocks or an ETF which tracks an index focused on dividends comes with one big worry: will the companies continue to pay dividends?  One of the surest signs that a stock is about to collapse is when the company announces it is reducing or eliminating the dividend.  While there is no way to guarantee that a stock will continue paying dividends, many investors look to the company’s past history for some hint of what it might do in the future. For those investors, a long history of consistent payments – or better yet, consistent dividend increases – is appealing.

The thought that a long history of increasing dividends could identify companies that would make an attractive dividend focused index is the idea behind the S&P 500 Dividend Aristocrats. Companies included in the index must have a history of at least 25 years of increasing dividends and be current members of the S&P 500. (They may not have been in the S&P 500 for all 25 years). Currently there are 53 stocks in the index, including some well-known names such as ExxonMobil, Walmart, Coca-Cola and PepsiCo.

Recognizing that past performance is not a guarantee of future results, one can see the past results compared to the S&P 500.  The chart shows monthly data for the S&P 500 and the S&P 500 Dividend Aristocrats, both measured as total return indices rebased to January 1990=100.

Further recognition was received when the S&P 500 Dividend Aristocrats index was named the Index Product of the Year 2014 at the William F. Sharpe Indexing Achievement Awards at the annual IMN Global Indexing and ETF Conference earlier this week in Scottsdale, AZ.

The posts on this blog are opinions, not advice. Please read our Disclaimers.