The S&P U.S. High Yield Low Volatility Corporate Bond Index (the HYLV index) was launched on Dec. 20, 2016, with the aim of capturing high yield bonds with less credit risk and lower return volatility than the broad investment universe of U.S. high yield bonds. One year after the index launch date, we present a performance analysis of the HYLV index versus the benchmark S&P U.S. High Yield Corporate Bond Index for 2017.
Exhibit 1 shows the performance decomposition for both indices. In 2017, carry was the biggest driver of performance, returning 5.9% for the benchmark and 4.8% for the HYLV index. Spread tightening contributed 2.8% return for the benchmark and 2.0% for the HYLV index, with the option-adjusted spread being tightened by 62 bps and 36 bps for the benchmark and the HYLV index, respectively.
Exhibit 1 also demonstrates the sources of performance difference between the HYLV index and the benchmark. Overall, the HYLV index underperformed the benchmark by 2.3%, including a carry of 1.1% and a spread of 0.8%. Underperformance of the HYLV index from carry and spreads in a spread-tightening environment is not surprising, given its lower yield profile and more defensive positioning of credit risk than the benchmark. More importantly, does the HYLV index mitigate portfolio risk and provide downside protection as it intends to?

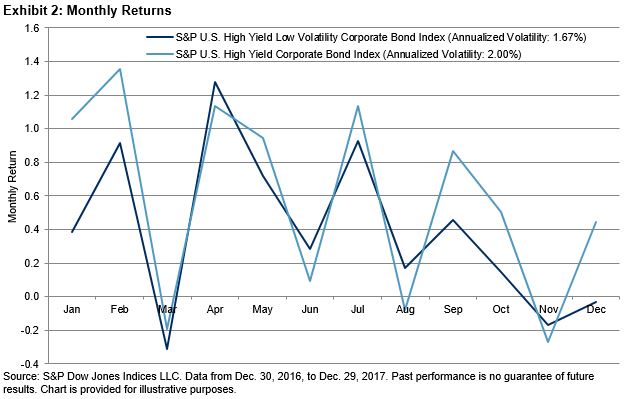
Exhibit 2 shows the monthly returns for the benchmark and the HYLV index. The HYLV index did show lower volatility, at 1.67% compared to 2.0% for the benchmark. Exhibit 3 includes the scatterplot of the relative return of the HYLV index over the benchmark from spread changes versus benchmark spread returns. The negative correlation of -0.66 between these two variables indicates that when the broad high yield universe benefited from spread tightening, the HYLV index underperformed the benchmark from spread changes, and that spread widening would have less downward impact on the HYLV index than the benchmark.