Thirty-five years ago on September 30, 1981 the 10 Year treasury yield peaked at 15.85%. With a few bumps it has slid downward ever since – until now. The events of the last few weeks moved interest rates higher and added about 25 bp to the ten year treasury. Even allowing for some near-term volatility it is increasingly likely that the low yield of 1.36% set on July 8, 2016 is the low.
The chart shows the pattern of yields going back 46 years for the Fed funds rate, T-bills, the ten year Treasury note and long maturity treasury bonds. The long maturity combines the yields on the 20 and 30 year treasuries because the government shifted the maturities of issues over time.

Why It Looks Like Up from Here:
Economic growth increases the demand for credit and puts upward pressure on interest rates. The US economy is growing. Third quarter GDP was 3.2%, the strongest figure in two years. Major GDP components except for government were significant contributors to growth. Other economic statistics also point to growth: with an unemployment rate of 5% the economy is close to full employment, housing sales and starts are gathering strength and consumer confidence points to further spending gains. These trends point to a rise in inflation and interest rates.
The economy will get a boost from the new administration’s widely discussed trillion dollar infrastructure program. Since current taxes do not cover current spending, the infrastructure program will be funded with debt. Any tax cuts will add to government borrowing and put further upward pressure on interest rates.
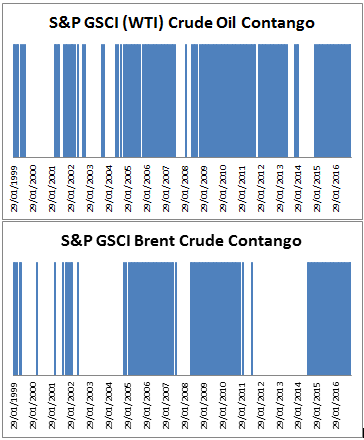
One immediate factor raising interest rates is oil. Follow the announcement yesterday of an agreement within OPEC to lower product, both oil prices and bond yields have jumped. Oil prices drive inflation and bond yields. However, the last few years proved that oil prices are volatile and unpredictable –the OPEC agreement could vanish and send oil back down to the 30s.
Higher inflation would mean higher interest rates. Despite the sense that inflation is almost zero, the numbers say otherwise and could go higher still. The CPI core rate – excluding the volatile food and energy sectors is about 2.2% for 2016 compared to 1.5% in 2013-14. The headline CPI has been held down by low oil prices; as this reverses due to the OPEC supply reduction agreement, headline inflation will climb above the core rate.
The last reason to expect higher inflation may be the first: The Fed. The central bank’s policy makers – the FOMC – will meet on December 14th. The committee is expected to raise the fed funds target by 25 bp. Moreover, if the economy continues to grow and government policy stays on track, there will be more Fed actions and higher yields in 2017.
A return to the double digit yields seen in the 1980s is not likely. Those were caused by high inflation, global oil embargos and wide-spread expectations that neither inflation nor interest rates would ever fall. It took two recessions, a 10.7% unemployment rate and a lot of economic pain to bring interest rates down and give us a 35 year bond rally.
The posts on this blog are opinions, not advice. Please read our Disclaimers.