Get Indexology® Blog updates via email.

In This List

Examining Sector and Factor Performance in the Third Quarter of 2016

VIX is holding the Trump card

Advisors Managing Interest Rate Risk With Municipal Bond Indices and ETFS

Latest Healthcare Cost Analysis Shows Individual Market Trends in Line With Employer Trends! – Part 2

Sustainability: Why Does the “Social” Category Matter?

Examining Sector and Factor Performance in the Third Quarter of 2016

Contributor Image
Nick Kalivas

Senior Equity Product Strategist

Invesco

High beta, value factors among the star performers, while low volatility lags amid heightened appetite for risk

The high beta, value and size factors outperformed the broad-market S&P 500 Index by a sizeable margin during the third quarter, with the S&P 500 High Beta Index gaining 12.18% during the three-month period – outpacing all other factor indexes. The S&P 500 Index rose a healthy 3.85%, but 14 smart beta strategies and two smaller-cap indices – the S&P SmallCap 600 Index and S&P MidCap 400 Index – all outperformed the broader market.

There was a nearly 14.70% total return gap between the best-performing factor (high beta) and the poorest-performing factor (low volatility) during the third quarter. This dispersion was greater than the second quarter’s performance gap, but less than that of the first quarter, which saw significant market volatility. Year-to-date, there has been an even wider performance chasm from top to bottom, with the Nasdaq Dividend Achievers 50 Index up 22.6% and the Russell Top 200 Pure Growth Index down 0.22%. This dispersion underscores the differentiated return streams of factor-based strategies.

 capture

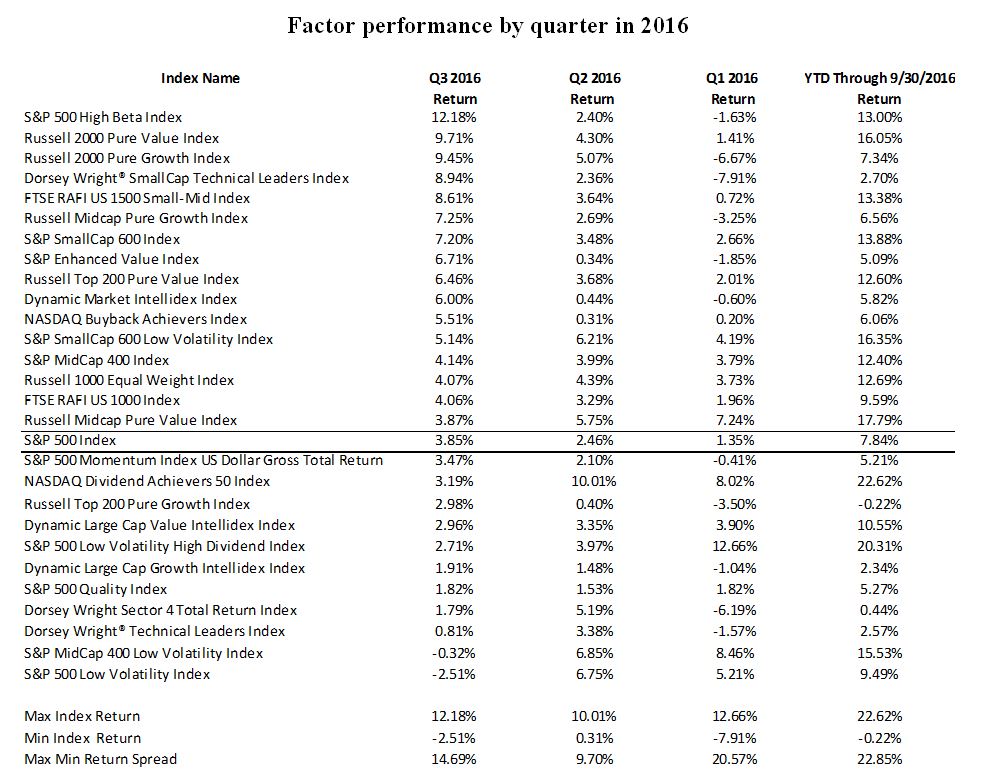
As you can see from the performance table above, some of the worst performers in the first quarter of the year turned out to be the best performers in the third quarter. Conversely, some of the best performers in the first quarter lagged in the third quarter. This is not unusual and again speaks to the diversification potential of factor-based strategies.

During the third quarter, the high beta factor benefited from heavy exposure to financials and energy stocks and limited exposure to utilities and consumer staples. Value-based strategies, represented by the Russell 2000 Pure Value Index and the Russell Top 200 Pure Value Index, also had significant exposure to financial and energy stocks, which boosted their returns.

High beta and value strategies were also buoyed by an improved economic backdrop. The ISM Index, considered a barometer of US industrial activity, jumped from 52.7 in May to 56.1 in June – its highest level since October 2015. Moreover, non-farm payrolls rose by more by than 270,000 in both June and July.

Narrowing credit spreads hint at increased risk tolerance
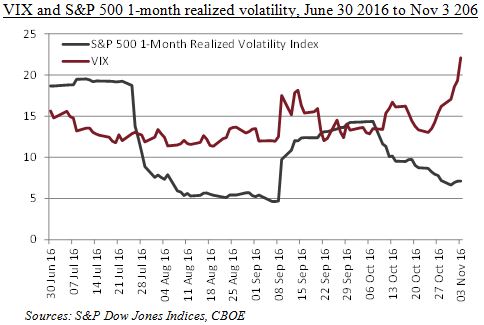
The improved outlook for economic growth led to a drop in high yield credit spreads during the quarter. The BarCap U.S. Corporate High Yield-to-Worst 10-year Treasury spread fell from 5.81 to 4.58, while the US 10-year Treasury yield bottomed out at 1.32% on July 6.1 Volatility, in the form of VIX, eased during the third quarter, falling from 15.63 to 13.20.1 Although the economy appeared less vibrant in September, a bias toward higher interest rates, a downward slant in high yield spreads and benign volatility were all favorable for investor risk taking.

Macro factors may not completely explain the favorable impact of energy exposure on value stocks and high beta based indices; stock selection was also important to energy sector returns. The 12-month Bloomberg Nymex Crude Oil Strip 12-Month Strip Futures Price Index finished the quarter at $50.46 – down marginally from Q2, but still above $50 for the second consecutive quarter. The rebound in oil prices coincided with OPEC’s decision to cut production in late September.1

Year-to-date, the Nasdaq Dividend Achievers Index has been the strongest performer – driven by energy and utilities and solid stock selection in financials, staples and industrials. The combination of dividend growth and yield was positive during the first half of 2016, and led to only slight underperformance in the third quarter.

What’s behind the performance of high beta stocks?
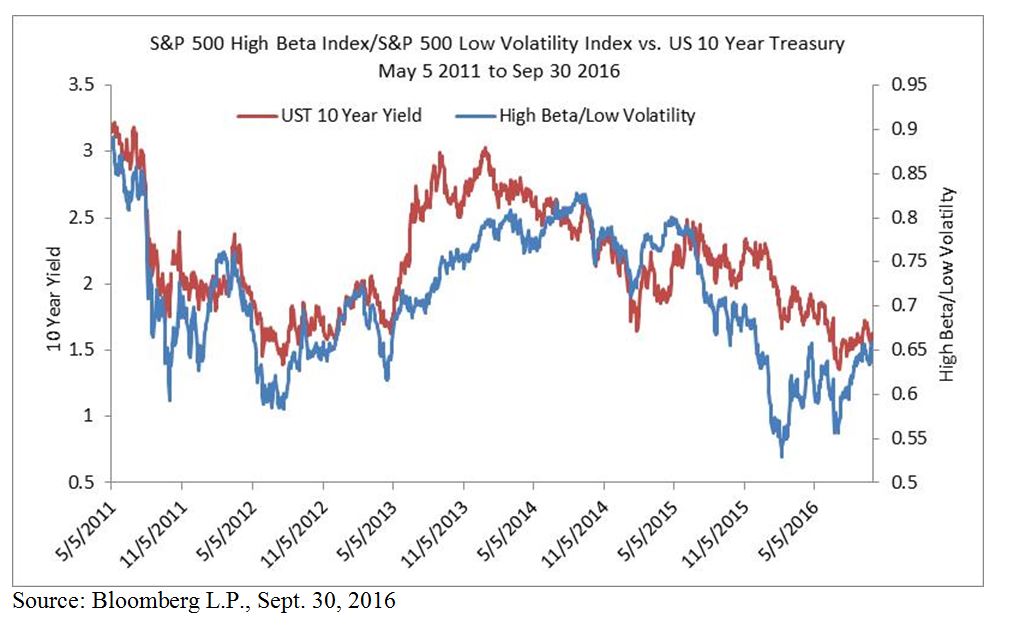
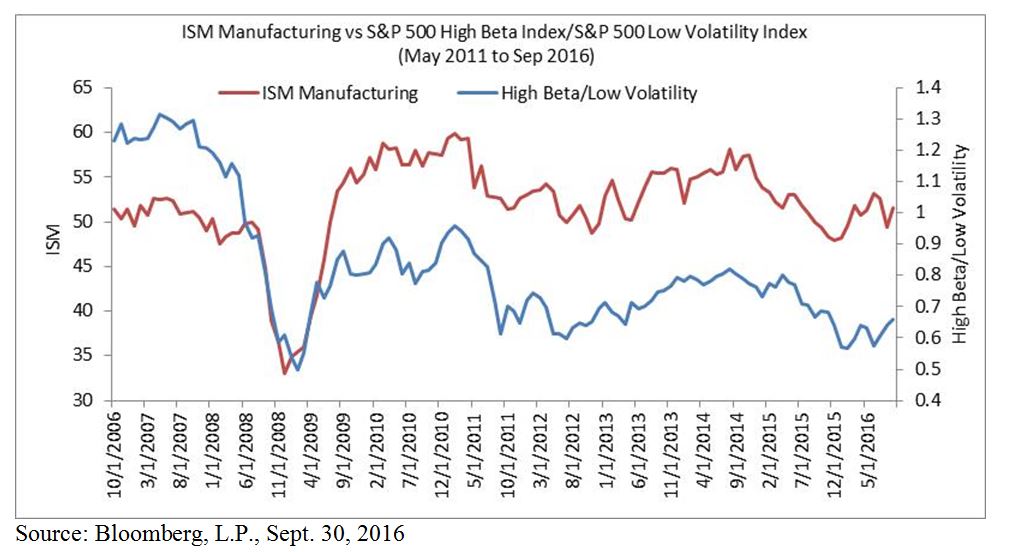
The strong quarterly performance of high beta stocks makes sense when you consider that high beta can outpace low volatility during periods of rising 10-year Treasury yields and stronger economic growth, when investor demand for defensive stocks may ease. The charts below depict this relationship.

capture

capture


The posts on this blog are opinions, not advice. Please read our Disclaimers.

VIX is holding the Trump card

Contributor Image
Tim Edwards

Managing Director, Index Investment Strategy

S&P Dow Jones Indices

Despite a narrowing election race and a deluge of earnings, the S&P 500 has not seen a daily change greater than 1% in nearly four weeks.  Realized volatility remains remarkably low.  But the CBOE Volatility Index (VIX) – a predictive measure of future volatility that is often seen as Wall Street’s “fear gauge” – has nearly doubled in the same period.  Is it the calm before the storm, or has VIX just got the jitters? vix-versus-rvol

Presently, the difference between VIX and S&P 500 realized volatility is highly significant. November 3rd’s closing VIX was 22.1 – nearly triple the S&P 500’s trailing volatility of 7.1.  A VIX higher than realized volatility is not unusual, especially when realized volatility is low, but the spread  between VIX and realized volatility has reached extremely rare levels.

The gap between VIX and realized volatility has been greater than 15 on only a handful of occasions in the past quarter century.  In most cases, an impending political event was the cause of the elevated VIX, and intriguingly, the subsequent performance in the S&P 500 was more commonly positive than negative.

big-spreads
The table provides grounds for optimism: with so much fear in evidence, one might assume that the current level of the S&P 500 reflects a discount for the market’s fears of a disruptive election result, not the current economic reality.  And indeed the day-to-day economic news has been encouraging: earnings have been largely positive and as far as the U.S Federal Reserve sees it, a case is easily made for the bulls.

But we may well ask “what if the pollsters and the betting markets – both of which are currently indicating a win for Hillary Clinton in the election – have it wrong?”

Volatility markets have precedent for predicting surprise results: it is notable that the spread from VIX to realized S&P 500 volatility rose as high as 13 on the day before the UK referendum in June.  In fact, the market’s anxiety over a potential vote to leave the EU was telegraphed in the currency volatility markets as much as three weeks before polling day.

Trump’s protectionist trade policy and political populism have drawn comparisons with the “Brexit” campaign, and the behavior of volatility markets in advance of the vote provides a further similarity.  If Trump does indeed win, we cannot claim that the VIX didn’t warn us. 


The posts on this blog are opinions, not advice. Please read our Disclaimers.

Advisors Managing Interest Rate Risk With Municipal Bond Indices and ETFS

Contributor Image
Shaun Wurzbach

Managing Director, Head of Commercial Group (North America)

S&P Dow Jones Indices

Given that our crystal balls are opaque for predicting interest rates, I thought it would be interesting to continue my interview with two financial advisors about managing interest rate risk in the municipal bond asset class.

Matt Papazian is founding partner and CIO at Cardan Capital Partners of Denver, Colorado, and

Tom Cartee is a financial advisor and portfolio manager at Sheets Smith Wealth Management of Winston-Salem, North Carolina.

S&P DJI: How are you using municipal bond indices and the ETFs that track them to manage interest rate risk?

Matt: ETFs give us the flexibility to manage interest rate and credit risk in a more efficient manner than individual bonds do.  Over the past few years, it has become increasingly difficult to find bonds with the exposures we need to adjust our portfolios.  ETFs solve that problem.

Tom: The introduction of target maturity municipal bond ETFs means that investment advisors that prefer to use ladders as a way of managing interest rate risk may continue to do so.  Individual municipal bonds may be employed for certain rungs of the ladder, with target maturity ETFs positioned in the remaining rungs.

S&P DJI: Coming out of the global financial crisis, we saw many advisors wanting to decrease the duration of their fixed income exposure.  What are your thoughts now on duration for municipal bonds?

Tom: I doubt that rates will climb dramatically, but higher yields may be on the way.  As long as rate increases are gradual, short- and intermediate-term municipal bonds are not likely to disappoint market participants.  In the long run, a healthy economy and less Central Bank distortion could be good for financial markets.

Matt: Since the global financial crisis, we have chosen a somewhat longer duration than the index.  This duration decision was predicated on the idea that rates would remain lower for longer and the rolling crisis environment of the last few years has rewarded that posture.  We are now in the camp that we are nearing the end of falling rates, but feel that any rate increases will be moderate, and to that end we have moderated our duration accordingly.

SPDJI: Municipal bond laddering is a classic approach some advisors use to manage interest rate risk and reinvestment risk.  How have maturity series indices and ETFs enabled your ability to construct bond ladders?

Matt: We manage our municipal ETF portfolio as a modified ladder.  We ladder duration, but then weight our durations based on our valuation work.  ETFs also allow us to simultaneously create a barbell of credit exposure.  The ability to manage both duration and credit is a powerful combination that ETFs make possible.

Tom: I agree with Matt.  The maturity series municipal bond ETFs have been a welcomed addition to our fixed income toolkit.

My thanks to Matt and Tom for participating in this interview and in a recent webinar that is available now in our webinar archive on Including Bonds in Your Strong Core.

The posts on this blog are opinions, not advice. Please read our Disclaimers.

Latest Healthcare Cost Analysis Shows Individual Market Trends in Line With Employer Trends! – Part 2

Contributor Image
Glenn Doody

Vice President, Product Management, Technology Innovation and Specialty Products

S&P Dow Jones Indices

In our last post, we talked about how individual line of business costs have come back in line with employer healthcare costs (see Exhibit 1).  In that piece, we discussed that one possible reason for this could be that individuals buying insurance for the first time under the new provisions of the Affordable Care Act (ACA), many of them with pre-existing conditions, are utilizing those benefits to address the conditions they had when they bought insurance.  Given these individuals would be subject to plan yearly out of pocket maximum costs, it only makes sense that they would address as many of those issues as possible before the plan year expires.  However, there is another possible explanation for the drop in costs.

capture

The second reason why we could be seeing a drop in individual market costs relative to the employer market is the pull back of many larger insurers from the ACA public exchanges.  By departing from the public exchanges, these health insurers are essentially opting to terminate coverage of individual policy holders in the state for which they have pulled out.  We have seen announcements for the departure of health plans from the public exchanges from large national organizations such as United Healthcare, Aetna, Cigna, and Humana.  However, more concerning are the regional plans and Blue Cross Blue Shield organizations, which tend to have a larger focus on the individual line of business.  Included in this group of plans that have announced their departure from the public exchanges are BCBS New Mexico, BCBH Minnesota, BSBS Nebraska, and others.  According to a Houston Chronicle article, in Texas alone, major plans such as Aetna, Cigna, Humana, United Healthcare, and Scott & White (a local player) have left the individual market void of options for coverage.  In addition, according to the Houston Chronicle, Blue Cross Blue Shield of Texas has asked for a nearly 60% increase in premiums just to cover the increased costs of care for new enrollees under the ACA.  The S&P Healthcare Claims Indices show enrollment was down nearly 20% in January 2016 for the individual market, and this is without taking into account the additional members expected to be pushed aside when many of the plans mentioned above are scheduled to either partially or entirely leave the public exchanges in January 2017.  According to a U.S. News article, Alabama, Alaska, and Oklahoma are among the states that will have one health insurer selling individual coverage on their exchanges next year.  South Carolina and most of North Carolina could join that list due to the Aetna decision.  A key reason why insurers state they are leaving the public exchanges is that they are failing to attract enough healthy individuals to pay for the high cost of care for new enrollees entering the market, leaving them with huge losses for this market segment.  If we look closer though, large insurers such as Aetna and United are not pulling out of all markets, only those they deem to be loss leaders.  We are also seeing this with smaller regional plans.  This means that they continue to participate in markets where costs are reasonable relative to expectations, or lower cost markets.  This is another possible explanation as to why costs fell so dramatically in January 2016, and why we may yet see another decline in January 2017 as high cost enrollees are pushed out of the market.

Though both scenarios likely contributed to the significant drop in per member per month costs in January 2016, it is more likely that the real cause is a combination of both, as well as several other marketplace factors.


The posts on this blog are opinions, not advice. Please read our Disclaimers.

Sustainability: Why Does the “Social” Category Matter?

Contributor Image
Emily Ulrich

Former Senior Product Manager, ESG Indices

S&P Dow Jones Indices

When it comes to sustainable investing, three factors are typically used as measurements: social, environmental, and governance.  For most of us, the benefit to reducing our environmental impact is obvious.  The importance of governance has also been well researched by S&P Dow Jones Indices—just look at the S&P LTVC Global Index.

The social factor, however, has been less examined.  As I mentioned in a previous blog post, social refers to mentalities in the workplace (e.g., diversity management, human rights, etc.), as well as any relationships surrounding the community (e.g., corporate citizenship and philanthropy).  It includes criteria such as human capital development, corporate citizenship, and occupational health and safety.

This “S” factor has become increasingly relevant to market participants.  In January 2016, the U.N. set the Sustainable Development Goals (SDGs)—17 goals with the ultimate purpose to “end poverty, protect the planet, and ensure prosperity for all.” Many of these incorporate crucial social factors, including the following.

  • No poverty
  • Good health and well-being
  • Quality education
  • Gender equality
  • Peace, justice, and strong institutions

Exhibit 1 shows all 17 goals.

capture

We are not just seeing social factors in government policy—we are also seeing an increase in interest from market participants.

In 2015, the Bank of Japan launched an initiative to invest in companies that are “proactively making investment in physical and human capital.”  In response to this announcement, S&P DJI and JPX launched the JPX/S&P CAPEX & Human Capital Index.  To measure something so abstract, we focused on three factors.

  • CAPEX + R&D expense growth
  • CAPEX revenue effect
  • Human capital score

This approach enabled us to capture both quantitative factors (CAPEX + R&D expense growth and CAPEX revenue effect) and qualitative factors (human capital score).  Quantitative factors are rather typical for finance, but non-financial factors can be a challenge—so how does one measure human capital?

We took certain criteria from RobecoSAM’s Classic ESG score that we felt encompassed human capital, including talent attraction & retention, labor rights, employee development, human rights, and employee turnover.  Exhibit 2 illustrates the 10-year historical performance of the index.

capture

The index has performed quite well, providing further evidence that sustainable investing may not include a sacrifice of performance.  Equally important going forward, we expect interest in the social factor to continue to grow among market participants, particularly as millennials enter the investment landscape.

The posts on this blog are opinions, not advice. Please read our Disclaimers.