Get Indexology® Blog updates via email.

In This List

Are You Looking for Outperforming Funds?

SPIVA® Europe Mid-Year 2016: Performance of Active Managers Has Been Disappointing This Year

Crude Reality of Enhanced and Excess Returns

A long time coming: Real estate moves out from under the shadow of financials – Part 2

Millennials and the Investment Shift

Are You Looking for Outperforming Funds?

Contributor Image
Priscilla Luk

Managing Director, Global Research & Design, APAC

S&P Dow Jones Indices

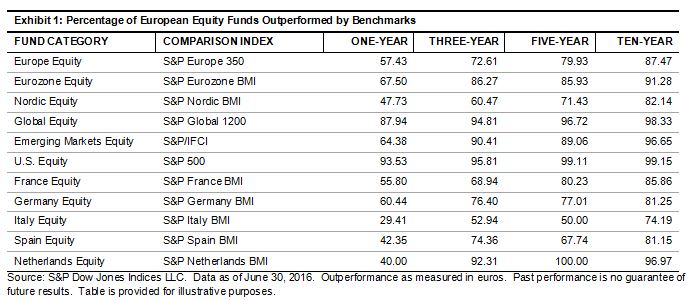
When one is paying management fees for the investment in active funds, one might reasonably expect the funds to outperform benchmarks and resist downturn when the market is volatile.  However, results from our S&P Indices Versus Active (SPIVA®) Scorecards[1] suggest this expectation is often not met.  SPIVA reports across different regions, including the U.S., Canada, Europe, Mexico, Chile, Brazil, South Africa, Australia, Japan, and India, show that benchmark indices outperformed the majority of their comparable actively managed funds over the five-year period ending June 30, 2016.

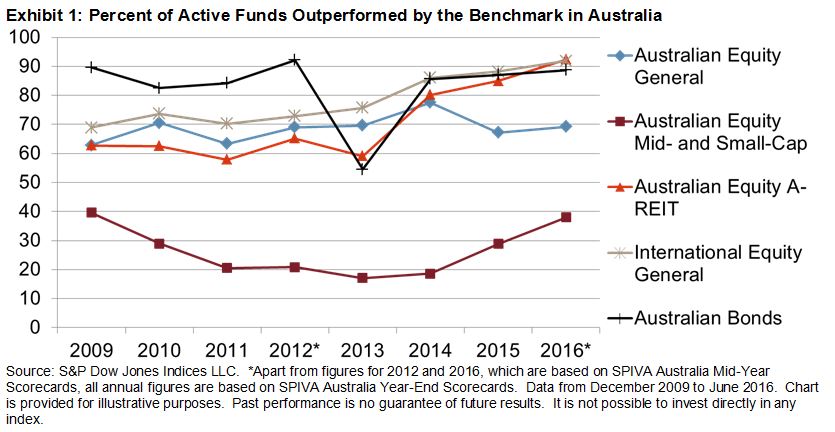
Since we published the first SPIVA Australia Scorecard in 2009, we have observed that the majority of Australian active funds in most categories have failed to beat comparable benchmark indices over three- and five-year horizons (with the exception of the Australian Equity Mid- and Small-Cap category).  As of June 2016, 69% and 38% of Australian Equity General (large-cap) and Mid- and Small-Cap funds underperformed the S&P/ASX 200 and S&P/ASX Mid-Small indices, respectively, over the five-year period.  The results for Australian Equity A-REIT, Australian Bonds, and International Equity General fund categories were far more disappointing; 92%, 89%, and 92% of funds in the three categories lagged their respective benchmark indices, respectively.

capture

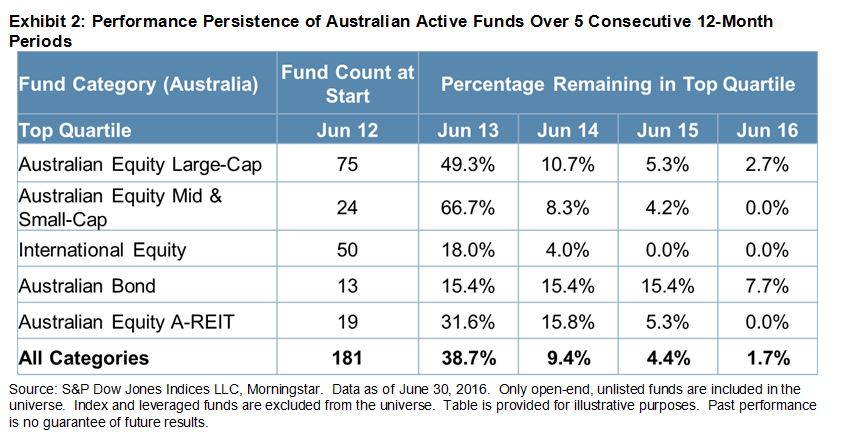
Though only a small portion of funds beat the benchmark indices in most fund categories, one might still attempt to find those outperforming funds.  However, based on our performance persistence analysis on Australian active funds, it is extremely challenging to pick winning streaks, as we found that few Australian active funds were consistent top performers.

Out of 181 top-quartile Australian active funds selected as of June 2012, only three (1.7%) managed to remain in the top quartile by June 2016.  There were 75 Australian large-cap equity funds and 13 Australian bond funds in the top quartile in June 2012, but just 2.7% (two funds) and 7.7% (one fund), respectively, remained in the top quartile four years later.  None of the top-quartile candidates from the Australian Equity Mid- and Small-Cap, Australian Equity A-REIT and International Equity General categories managed to stay in the top quartile over the next four consecutive years.

Similar results were observed in the performance consistency analysis of U.S. active funds over consecutive years.  According to the S&P Dow Jones Indices Persistence Scorecard: August 2016, less than 1% of U.S. domestic funds that began as top-quartile performers in March 2012 ended up in the top quartile almost four years later.  This indicates that actively managed funds may have difficulty remaining in the top quartile over a five-year period.

capture

Based on results from the SPIVA Scorecards, identifying outperforming active funds is no easier than selecting winning securities.  While there are decades of research on factor-based or trading strategies attempting to beat the market, there is much less analysis and research on selecting outperforming funds.  Considered together with the observed inconsistency of active fund performance, finding funds that beat the benchmark for several consecutive years may appear an inconceivable mission.

[1]   Twice a year, we publish SPIVA Scorecards, which track the number of active funds that beat their comparable benchmarks over one-, three-, and five-year timeframes in different regions.

The posts on this blog are opinions, not advice. Please read our Disclaimers.

SPIVA® Europe Mid-Year 2016: Performance of Active Managers Has Been Disappointing This Year

Contributor Image
Daniel Ung

Former Director

Global Research & Design

European equity markets fared poorly over the one-year period ending June 30, 2016, with the S&P Europe 350® decreasing 10.47%.  This underwhelming performance was brought on by heightened volatility following the U.K.’s vote to exit the European Union, as well as the negative interest rate policy in Europe.  Normally, these conditions might be considered ideal for active managers to perform well, but they actually underperformed in most categories analyzed in the SPIVA Europe Mid-Year 2016 report.  Overall, about 57% of active fund managers investing in pan-European equities underperformed their benchmark over the one-year horizon ending June 30, 2016 (see Exhibit 1).  This statistic deteriorated over the long run, with over 87% of active managers underperforming their benchmark over the 10-year period.

In regard to active funds invested in emerging markets, global equities, and the U.S., the statistics were even starker.  Over 98% of active managers investing in global equities lagged their respective benchmark over the 10-year period ending June 30, 2016, and over 96% of active managers invested in emerging market equities trailed their corresponding benchmark over the same period.

capture

The posts on this blog are opinions, not advice. Please read our Disclaimers.

Crude Reality of Enhanced and Excess Returns

Contributor Image
Jodie Gunzberg

Former Managing Director, Head of U.S. Equities

S&P Dow Jones Indices

(“Excess Return” does not mean any additional return on the ETF’ s performance) is a footnote in an ETF provider’s investment objective about an ETF that tracks the S&P GSCI Crude Oil Excess Return.  That disclaimer is true but never explains what excess return means in terms of additional performance.  After all, excess means more, and more return is good OR is anything in excess likely to be bad?

The “excess return” name describes the version of the indices that measures the change in the spot price of the futures contract plus the return from rolling the expiring futures contract into a new one.  In other words, the excess return is the additional return from holding futures contracts through time rather than the spot commodity.  Back in 1991, when the S&P GSCI was launched, excess return was positive.  However, since 2005, the premium has mostly turned into a discount that makes holding futures contracts more expensive than the spot. The “excess return” meaning switched from more return to less return.

Source: S&P Dow Jones Indices.

Shortages were prevalent before 1991, causing a premium on the futures contracts with nearby expiration dates.  This is since processors are willing to pay extra to have immediate access to a commodity during a shortage. For example, a refiner is likely to pay a premium to have oil when there is a shortage so that its production of gas is not disrupted. The chart below shows the less inventory available, the more one will pay for the convenience of owning the commodity.

Source: “The Long and Short of Commodity Index Investing”, by Jodie Gunzberg and Paul Kaplan, Intelligent Commodity Investing, edited by Hilary Till and Joe Eagleeye 2007.

In response to a world in fear of running out of resources, producers raced to supply commodities they thought the market needed. Inventories grew into excess circa 2005 just before the global financial crisis dried up demand.  The reality of an ending Chinese super-cycle in the face of an oil supply war, together with a range of unfavorable macro factors like a strong U.S. dollar, low interest rates, low inflation, and low growth plagued the last decade for commodities. This left an abundance of oil driving the excess return to be negative, the condition that still holds today.

In response to the negative excess returns, a myriad of new indices emerged to modify contract selections and rolling strategies to reduce the loss. One of the early but still popular strategies is called “enhanced”. The S&P GSCI Crude Oil Enhanced Excess Return selects whether to hold the nearby most liquid contract, or the later-dated December contracts (of the current year (Jan-Jun) or next year (Jul-Dec)) based on the amount of contango (or excess inventory leading to negative excess return) and rolls in the 1st-5th business days of every month, rather than the typical 5th-9th.

Since 1995, the enhanced modification has added 0.54% per month on average that equates to a 7.49% annualized return for the S&P GSCI Crude Oil Enhanced ER versus -0.33% annualized return for the S&P GSCI Crude Oil ER.

Source: S&P Dow Jones Indices
Source: S&P Dow Jones Indices. ER stands for Excess Return

Just like “excess” means more, “enhanced” means better.  However, just like excess return can be negative, enhanced can underperform. For the third consecutive month (as of Oct. 21, 2016,) the S&P GSCI Crude Oil Enhanced ER is underperforming the S&P GSCI Crude Oil ER, so investors are wondering why the enhanced strategy not not working.

There are four conditions to evaluate how the enhanced oil strategy works. 1. Crude oil is negative and excess return is negative, 2. Crude oil is negative and excess return is positive, 3. Crude oil is positive and excess return is negative, and 4. Crude oil is positive and excess return is positive.  The major outperformance of the enhanced oil happens in the case where oil is negative and the excess return is negative. This makes sense since the strategy was designed to reduce the loss from negative excess returns. There is minimal impact when excess return is positive since the enhanced index holds the front contract that is the same as in the original strategy. Some performance difference can be attributed to the different rolling days and some difference happens in months where the term structure changes mid-month before the enhanced index can move to the contract assigned for the condition. The worst scenario for the crude oil enhanced is when crude oil is positive but the excess return is still negative. This happens since as the oil price is increasing, it takes time for the excess inventory to draw down, that drives the excess return to remain negative until a shortage happens. The enhanced rules have a 0.5 contango (or negative excess return) threshold to push the contract out to a later expiration, so there are months in the transition where a smaller negative excess will force the enhanced version into the nearby most liquid contract despite some contango from the remaining abundance.

Source: S&P Dow Jones Indices. Monthly data from Jan 1995.

The crude oil positive and excess return negative is the condition now that is underlying the S&P GSCI Crude Oil Enhanced ER underperformance.  How long might that last is the next question investors want to know. Historically, there have been five major periods of this condition lasting on average 13.8 months with the shortest period lasting 5 months and the longest lasting 34 months.

Source: S&P Dow Jones Indices

After 9 months since the bottom of oil and a persistent abundance, the tide might be turning. The excess return is the smallest negative it has been at since July 2015, and is now just under 1%. The outcome of OPEC’s effort to cut production and the ability of non-OPEC to keep supplies low will impact how long this recovery takes. The key risks are that OPEC’s cuts are too little too late – or they don’t agree on a production cut at all, and China may increase oil imports more before the price rises even higher  – that will reduce demand later and possibly extend recovery time, especially if they start exporting more to turn a profit. Also, US inventories need to decline, the weather needs to get cold, China’s growth needs to pick up to help the oil market rebalance.

The posts on this blog are opinions, not advice. Please read our Disclaimers.

A long time coming: Real estate moves out from under the shadow of financials – Part 2

Contributor Image
Nick Kalivas

Senior Equity Product Strategist

Invesco

Interest rates have influenced the performance of REITs relative to bank shares

Interest rates have a strong influence on equity REIT performance, as evidenced by the graphic below, which displays the relationship between the 10-year Treasury yield and the relative performance of the S&P 500 Banks Index to the S&P 500 Real Estate Investment Trusts REITS Industry Index.  Note that banks have generally outpaced REITs when interest rates are rising, and have tended to lag when interest rates are declining. This relationship can be most clearly seen after the Great Recession (early 2009).

This pattern of relative performance may be linked to improved bank profitability in a high or rising interest rate environment and the desire of investors to own REITs for yield purposes in a falling or low rate environment. In a sense, REITs become a bond substitute. The breakout of REITs from the financials sector may better focus investors on the relationship between banks and REITs.

capture

This chart also indicates that the price of bank stocks have been lagging the price of REITs for more than a decade. The price ratio of the S&P 500 Real Estate Investment Trusts REITS Industry Index to the S&P 500 Banks Index was over 4.0 in 2004 and has slumped to 1.5, although it is off the low seen in 2012.1

A potential rise in rates could have ramifications for bank stocks, REITs

Banks may look cheap relative to REITs right now, but a catalyst will likely be needed to reverse that trend. Higher interest rates would be one such catalyst. Predicting the direction of the 10-year Treasury yield is always difficult. However, the pace of economic growth, the direction of inflation and interest rates overseas may help investors interpret the interest rate landscape and outlook for the relative performance of bank shares to REITs. Let’s review the factors:

  • Economic growth has found firmer footing of late due to a more favorable inventory cycle (a decline in the growth rate of the inventory-to-sales ratio) and reduced headwinds from foreign exchange, as the US dollar has traded more sideways over the past year. Industrial production was down 0.5% year over year in July, but up from a trough of -2.0% in March.1 To put the current level of industrial production into context, industrial production peaked at 3.9% in July 2014.1 Movement of production into firmly positive growth territory could be a catalyst that lifts yields.
  • Inflation has shown signs of slow acceleration. The consumer price index less food and energy has risen to 2.2% on a year-over-year basis from its February 2014 low of 1.6%.1 However, it has not been able to breach the post-recession high of 2.3% established in April 2012 and February 2016.1 A rally in inflation over 2.3% could put upward pressure on the 10-year Treasury yield and focus the Treasury market more closely on inflation.
  • Lastly, yields remain negative in Germany and Japan and make the current Treasury yield just below 1.60% look attractive. A normalization of rates in Germany and Japan could lead to higher 10-year Treasury yields.

———————————————————————————

Important information
Correlation is the degree to which two investments have historically moved in relation to each other.
Dividend yield is the amount of dividends paid over the past year divided by a company’s share price.
Price ratio compares the price of one security (or basket or securities) to another security (or basket of securities). In this case, the prices of two indexes are compared.
A real estate investment trust (REIT) is a closed-end investment company that owns income-producing real estate.
Relative performance refers to the performance of an asset or investment relative to another asset, investment or benchmark.
The consumer price index (CPI) measures change in consumer prices as determined by the US Bureau of Labor Statistics.
The CBOE Volatility Index® (VIX®) is a key measure of market expectations of near-term volatility conveyed by S&P 500 stock index option prices. VIX is the ticker symbol for the Chicago Board Options
Exchange (CBOE) Volatility Index, which shows the market’s expectation of 30-day volatility.
The Dow Jones U.S. Mortgage REITs Index comprises real estate investment trusts, corporations or listed property trusts that are directly involved in lending money to real estate owners.
The S&P 500 Real Estate Investment Trusts REITS Industry Index defines and measures the investable universe of publicly traded real estate investment trusts domiciled in the United States.
The S&P 500 Utilities Sector Index is an unmanaged index considered representative of the utilities market.
The S&P 500 Financials Index comprises those companies included in the S&P 500 that are classified as members of the GICS® financials sector.
The S&P Banks Index comprises stocks in the S&P Total Market Index that are classified in the GICS asset management & custody banks, diversified banks, regional banks, other diversified financial services and thrifts & mortgage finance sub-industries.
The S&P Insurance Select Industry Index comprises stocks in the S&P Total Market Index that are classified in the GICS insurance brokers, life & health insurance, multi-line insurance, property and casualty insurance and reinsurance sub-industries.
The S&P 500® Index is an unmanaged index considered representative of the US stock market.
The S&P 500 Diversified Financials Industry Group Index is a capitalization-weighted index that is considered representative of the diversified financials industry group.
An investor cannot invest directly in an index.
Past performance is no guarantee of future results.
There are risks involved with investing in ETFs, including possible loss of money. Shares are not actively managed and are subject to risks similar to those of stocks, including those regarding short selling and margin maintenance requirements. Ordinary brokerage commissions apply. The Fund’s return may not match the return of the Underlying Index. The Fund is subject to certain other risks. Please see the current prospectus for more information regarding the risk associated with an investment in the Fund.
Investments focused in a particular industry or sector are subject to greater risk and are more greatly impacted by market volatility, than more diversified investments.
Investments in real estate related instruments may be affected by economic, legal, or environmental factors that affect property values, rents or occupancies of real estate. Real estate companies, including REITs or similar structures, tend to be small and mid-cap companies and their shares may be more volatile and less liquid.
Treasury securities are backed by the full faith and credit of the US government as to the timely payment of principal and interest.
Shares are not individually redeemable and owners of the Shares may acquire those Shares from the Fund and tender those Shares for redemption to the Fund in Creation Unit aggregations only, typically consisting of 50,000, 75,000, 100,000 or 200,000 Shares.
The information provided is for educational purposes only and does not constitute a recommendation of the suitability of any investment strategy for a particular investor. Invesco does not provide tax advice. The tax information contained herein is general and is not exhaustive by nature. Federal and state tax laws are complex and constantly changing. Investors should always consult their own legal or tax professional for information concerning their individual situation. The opinions expressed are those of the authors, are based on current market conditions and are subject to change without notice. These opinions may differ from those of other Invesco investment professionals.
NOT FDIC INSURED
 MAY LOSE VALUE
 NO BANK GUARANTEE
All data provided by Invesco unless otherwise noted.
Invesco Distributors, Inc. is the US distributor for Invesco Ltd.’s retail products and collective trust funds. Invesco Advisers, Inc. and other affiliated investment advisers mentioned provide investment advisory services and do not sell securities. Invesco Unit Investment Trusts are distributed by the sponsor, Invesco Capital Markets, Inc., and broker-dealers including Invesco Distributors, Inc. Each entity is an indirect, wholly owned subsidiary of Invesco Ltd. PowerShares® is a registered trademark of Invesco PowerShares Capital Management LLC, investment adviser. Invesco PowerShares Capital Management LLC (Invesco PowerShares) and Invesco Distributors, Inc., ETF distributor, are indirect, wholly owned subsidiaries of Invesco Ltd.
©2016 Invesco Ltd. All rights reserved.

The posts on this blog are opinions, not advice. Please read our Disclaimers.

Millennials and the Investment Shift

Contributor Image
Emily Ulrich

Former Senior Product Manager, ESG Indices

S&P Dow Jones Indices

Lately, it seems like millennials have been everywhere: in the news, peppered throughout pop culture, and a serious topic of debate among the investment and financial landscape.

So—who are the millennials and why do they matter?  What impact will their wealth and world views have on sustainable investing?

“Millennials” refers to the generation born between 1980 and 2000.  They are crucial to shaping the future of global investment landscape, as they are expected to compose more than 50% of the workforce by 2020.[1]  It is also estimated that over the next several years, they will be on the receiving end of a generational transfer of personal wealth of USD 59 million.[2]

So what can we expect them to do with that wealth?

We know that millennials have grown up in an economic recession and this has had an impact on both their trust in the economy (and investing in particular) and their loyalty to employers.

In a 2008 survey of millennials, [3] PWC found that, of those surveyed, 75% believed they would have two to five employers, whereas in 2011, that number dropped to 54% and more than 25% reported that they expect to have six employers or more, compare with only 10% who felt the same in 2008 – thereby revealing the nomadic traits of the workplace. This decrease in loyalty may also spread to financial institutions. In a 2015 survey, LinkedIn and Ipsos found that 57% of millennials would be open to try financial offerings from non-financial brands.[4]

In a 2011 survey of millennials, PWC found that, of those surveyed, 54% expected to have two to five employers in their lifetime, whereas, in 2008, 75% believed they would have two to five employers.  In the 2011 survey, more than 25% reported that they expect to have six employers or more, compared with only 10 % who felt the same in 2008—this reveals the nomadic traits of the new generation in the workplace.

Both PWC and LinkedIn also found that millennials care deeply about their personal values and morals.  This is crucial to the future of sustainable investing.  Millennials, who value their moral compasses so highly, will also care deeply about where their money goes.  Sustainable investing is the perfect solution to address many of those concerns. It is incredibly important for financial providers to recognize these concerns, particularly as millennials have signaled an openness toward non-traditional financial offerings.

In the current passive investment space, market participants can choose from a wide range of indices that relate to personal values, including human capital, climate change mitigation, long-termism, faith based, and social responsibility.  Looking toward the future, millennials could be expected to be key drivers of sustainable investment.

[1] https://www.pwc.com/m1/en/services/consulting/documents/millennials-at-work.pdf

[2] https://www.bc.edu/content/dam/files/research_sites/cwp/pdf/A%20Golden%20Age%20of%20Philanthropy%20Still%20Bekons.pdf

[3] http://www.pwc.com/gx/en/issues/talent/future-of-work/download.html

[4] https://business.linkedin.com/content/dam/business/marketing-solutions/global/en_US/campaigns/pdfs/affluent-millennial-research-whitepaper-eng-us.pdf


The posts on this blog are opinions, not advice. Please read our Disclaimers.