The last few days of February had many wondering whether corporate bond indices would end up closing positive or negative for the month. The majority of indices closed up for February, but not by much.
Higher-quality corporate bonds, as measured by the S&P 500® Bond Index, posted a 0.83% total return for February and returned 1.18% YTD. The breakdown between investment grade and high yield was all positive, as the S&P 500 Investment Grade Corporate Bond Index returned 0.79% for the month and 1.22% YTD, and the S&P 500 High Yield Corporate Bond Index returned 1.39% for the month and 0.94% YTD.
The S&P U.S. Investment Grade Corporate Bond Index returned 0.68% for February. U.S.-issued bonds, as measured by the S&P U.S. Issued Investment Grade Corporate Bond Index, returned 0.81% for the month. Meanwhile, foreign-issued U.S. dollar bonds, as measured by the S&P U.S. Foreign Issued Investment Grade Corporate Bond Index, returned 0.28% in February, and since it accounts for 25% of the S&P U.S. Issued Investment Grade Corporate Bond Index, the drag down effect for February hurt the overall return.
In the high-yield category, all but CCC and lower and leveraged loans pulled off positive returns for the month. In February, the S&P 500 High Yield Corporate Bond Index returned 1.39%, while the broader S&P U.S. High Yield Corporate Bond Index returned 0.40%. Leveraged loans, as measured by the S&P/LSTA U.S. Leveraged Loan 100 Index, underperformed and returned -0.21% for the month and
-0.64% YTD. After returning -2.75% for 2015 and losing -0.42% in January, leveraged loans are still bearing the brunt of concern over lower credits.
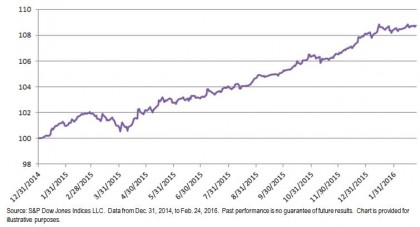
The yield-to-worst of the S&P/BGCantor Current 10 Year U.S. Treasury Index ended the month 18 bps tighter, at 1.75%. Continued concerns over commodity prices and the pace of economic recovery both domestically and internationally has kept rates lower. China continues to be a question mark, as the most recent PMI reports point to a deepening slowdown.
Exhibit-1: Total Rate of Return Performance
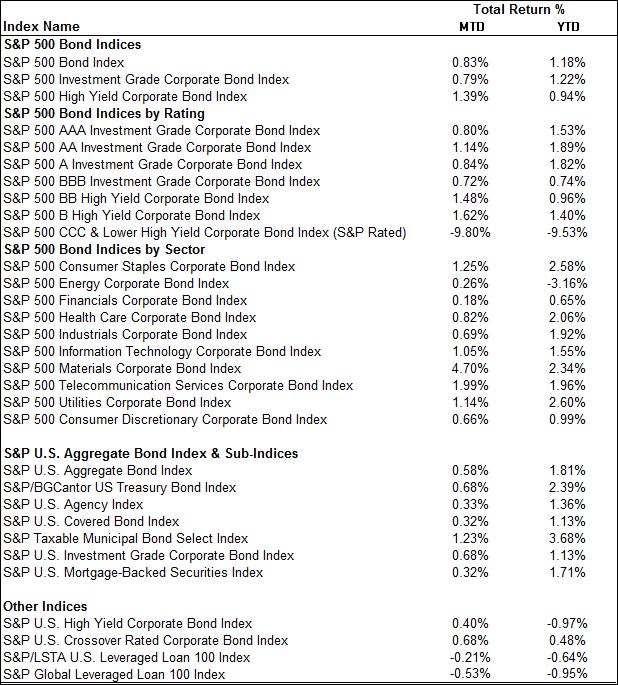
Source: S&P Dow Jones Indices LLC. Data as of Feb. 29, 2016. Past performance is no guarantee of future results. Table is provided for illustrative purposes.
The posts on this blog are opinions, not advice. Please read our Disclaimers.