Get Indexology® Blog updates via email.

In This List

Five-Year Itch in the Condo Market?

Beware The Bear: Turning Points Indicated By Mean Reversion

Sorry, Wrong Number

Can indexes help organizations manage the financial risk of healthcare costs?

Your Core Portfolio

Five-Year Itch in the Condo Market?

Contributor Image
Marya Alsati

Former Product Manager, Commodities, Home Prices, and Real Assets

S&P Dow Jones Indices

In a prior post, we analyzed the holding period of single-family homes using the S&P/Case-Shiller Home Price Index Series. We quantified the holding period with the rolling return for each period in question—10-, 7-, 5- and 3-year holding periods. In this post, we use the same holding period concept to look into whether the condo market behaves differently than the single-family homes market and assess whether the same pattern holds across the different cities. The cities investigated are Boston, Chicago, Los Angeles, New York and San Francisco. We found that the five-year holding period was the worst-performing holding period across the five cities.

In the single family market, the longer 10-year holding period fared better than the shorter duration periods, and we found that of the shorter duration periods, the three-year period performed better than the five-year period. In the condo market in all five cities, the five-year period experienced the largest decline. To rule out that the cause of the five-year decline was the trough in 2012, we looked at the holding period’s behavior prior to 2012, and we found that the time period that experienced the largest decline was indeed the five-year period.

So what is the cause of this five-year itch? On average, American home owners sell and move every five-to-seven years according to the Census, for reasons ranging from the house being too small to a job transfer. Many variables that drive single-family homes drive the condo market: upgrade, change in demographic, the need to move to a single family home, neighborhood changes, cash in equity, etc. Property owners are less likely to base their decision to buy or sell on the state of the market, and they are more likely to make the decision for personal reasons, because it’s where they live and the place most likely to affect their quality of life.

We did find that while the five-year period was the one that fared the worst, the range of returns—gains and losses—varied across the five cities. The following charts show the different holding periods for Chicago and Los Angeles.

Capture

Capture

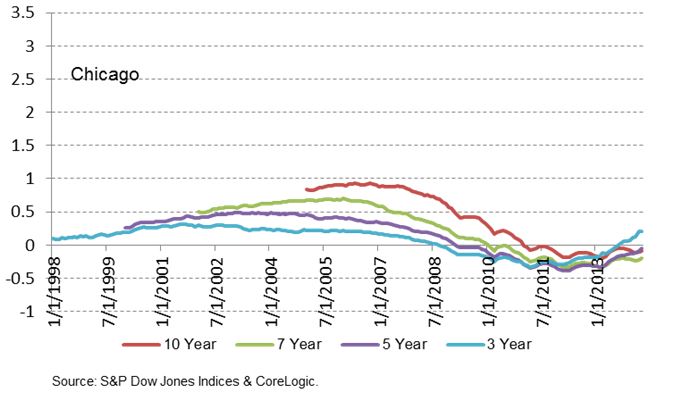
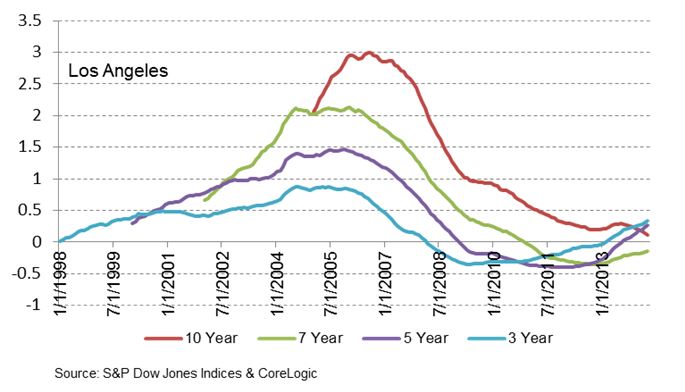
In the 10-year holding period, Chicago faired worst having the smallest gain of 93% and the largest decline of 20%. Los Angeles had the maximum gain of 300%. New York didn’t enter into negative territory in the ten year holding period with the smallest gain being 37%. Overall, home owners could benefit from longer holding periods in the condo market, albeit differently depending on their geographic location, but they may need to watch out for that five-year itch.

The posts on this blog are opinions, not advice. Please read our Disclaimers.

Beware The Bear: Turning Points Indicated By Mean Reversion

Contributor Image
Jodie Gunzberg

Former Managing Director, Head of U.S. Equities

S&P Dow Jones Indices

What a difference a summer makes. While many of us enjoy perfect weather, it is a nightmare for a long-only investor in agricultural commodities. Further, the drop in energy from easing supply disruptions in the middle east and slowing demand from China and the Eurozone have caused the Dow Jones Commodity Index (DJCI) to lose 7.3% in the third quarter and the S&P GSCI to lose 8.5%. This is a stark contrast from the first half of the year where the DJCI gained 5.4% and the S&P GSCI gained 7.7%. From the peaks on June 19, the indices are down 9.9% and 8.5% for DJCI and S&P GSCI, respectively.

Source: S&P Dow Jones Indices. Data from Jan 2, 2014 to Sep 5, 2014. Past performance is not an indication of future results.

The DJCI is halfway to the bear market, but this may not be the worst news for investors. As mentioned in the comments of a prior post, I have discussed in two book chapters, Absolute Returns in Commodity (Natural Resource) Futures Investments in Hedge Fund & Investment Management (Edited by Izzy Nelken) and also in The Long and Short of Commodity Futures Index Investing in Intelligent Commodity Investing (Edited by Hilary Till and Joseph Eagleye,) there are two major opportunities to capture returns in commodities, which are cyclical opportunities and systematic opportunities. Trend following systems can capture cyclical opportunities in commodities because only price can respond to balance supply and demand. This is since commodities in the short-run cannot be drilled, mined and grown causing relatively slow cycles of inventory building, which in-turn drives patterns of commodity prices to trend up and down. So, when there is a supply/usage imbalance in a commodity market, its price trend may be persistent, which may be captured by trend-following programs.

Trend following is strong historically in times of persistent shortages (backwardation) since the replenishing of inventories of commodities in shortage may be time consuming. Trend following may also work in times of persistent excess (contango) However, the run of contango commodities experienced from 2005-2012, seems to have ended and commodities are currently hovering at the line near equilibrium where short term disruptions swing the pendulum quickly.

It is debatable whether the shortages that appeared in 2013 and the first half of 2014 are gone for good. The inventory buildup may be temporary based on weather and geopolitics. However, one must keep focus on longer term factors like the strength of the dollar (which is historically inverse to commodity prices), rising inflation, rising interest rates and demand forces coming from China and other parts of the world.

Please join us along with +2,200 investment professionals for our S&P Dow Jones 8th Annual Commodity Seminar featuring Rob Arnott, Bob Greer and Kevin Norrish to find out answers to the following questions:

  • Why do you think investors are continuing to withdraw money from commodity index investments despite recent improvements in the performance of the asset class?
  • What is the likelihood of another sustained period of above average commodity index returns anytime soon?
  • To what extent is the withdrawal of investment money, itself responsible for poor return performance of commodity indices?
  • What commodity investment strategies are likely to perform best over the next year or so?
  • Are we ever likely to see a return to the huge commodity investment inflows of the mid-2000s or was that a one-off?
  • How large of an allocation to commodities, if any, belongs in the typical policy portfolio?
  • During the financial crisis commodities suffered big losses. Shouldn’t they provide diversification?
  • Some investors argue that deflation is a bigger threat than inflation right now. Should we still be worried about inflation?
  • If investors don’t actually buy commodities, how can they hedge against inflation?
  • If futures markets are efficient, is there an inherent return to commodity indexes?
  • In your description of “supra asset classes”, where does gold fit?


The posts on this blog are opinions, not advice. Please read our Disclaimers.

Sorry, Wrong Number

Contributor Image
Craig Lazzara

Former Managing Director, Index Investment Strategy

S&P Dow Jones Indices

Last week brought yet another indication that 2014 is proving to be a very difficult environment for active stock selection strategies.  With the majority of large cap U.S. equity managers underperforming the S&P 500, “only performances in 2006, 2010 and 2011 have been as bad or worse than the current year’s pace.”

Well, in any series with variation, some years will be better than average and some will be worse, and to readers of our SPIVA reports it’s hardly a secret that most active managers fail most of the time.  But what seems particularly troubling to some commentators in 2014 is that the underperformance of active managers has occurred in the face of below-average correlations in most equity markets.  Indeed, earlier this year a number of market analysts opined that 2014 would witness the long-awaited “stock-picker’s market,” providing respite to fundamental managers whose performance had been beleaguered by years of indiscriminately-high correlations.

The prediction that correlations would decline was correct.  But if you’re interested in gauging the potential success of active stock selection strategies, correlation is the wrong number to predict.  Here’s a simple illustration of why:

A and B part 2

C and D

Where would active stock picking be more profitable: in choosing between A and B, or between C and D?  Each pair averaged a return of 6.85%, but the graphs make obvious that the correct choice between C and D was worth a lot, despite their perfect correlation.  And the difference between A and B was de minimis, despite their negative correlation:

ABCD summary

Late last year we introduced the concept of dispersion as a measure of market opportunity.  Our simple example illustrates, as we’ve argued before, that dispersion is a better measure of stock selection opportunity than is correlation.  And, unfortunately for the advocates of active management, dispersion remains at historically low levels.  Regardless of how correlations change, the opportunities for active stock pickers will languish until dispersion rises.

The posts on this blog are opinions, not advice. Please read our Disclaimers.

Can indexes help organizations manage the financial risk of healthcare costs?

Contributor Image
Michael Taggart

Consultant, S&P Healthcare Indices

S&P Dow Jones Indices

Moving past the political debate around Obamacare, the news last month drove home a more important point – not only are healthcare costs high and increasing, but the rate at which these costs increase (trend) is also volatile. Walgreens made headlines when it announced that FY 2016 pharmacy earnings would drop by over $1.1 billion dollars. The fact that an organization with the healthcare expertise and resources of Walgreens can miss earnings by over a billion dollars shows how difficult the problem of managing healthcare cost trends can be. This problem is compounded because unlike many other industries, the healthcare industry has very few tools available for managing the financial risk of cost trends.

From the outset, the S&P Healthcare Claims Indices have been designed to support financial hedging tools that could allow organizations exposed to future healthcare cost trends to manage that risk. By providing a broad range of indices that track the key measures of healthcare cost trends (such as drug costs, hospital costs, regional trends and insurance plan trends), the indices can be tailored to allow organizations to track the specific cost trends that are critical to their own situation. In cases such as Walgreens, the ability to hedge exposure to the impact of future price changes in generic/brand drugs (or changes in utilization) could have provided a solution to the inherent risk of volatile trends. Although the S&P Healthcare Claims Indices have only been available since October 2013, some organizations such as health insurance carriers and employers are already beginning to look to the indices as a way to hedge financial exposure. The application of index based risk management tools to healthcare financing is an exciting development and could be a critical component in bringing healthcare costs under control.

The posts on this blog are opinions, not advice. Please read our Disclaimers.

Your Core Portfolio

Contributor Image
Daniel Gamba

Managing Director

BlackRock

In my post on ETFs in the Core in May, I mentioned that the goal of most investors is to manage risk, seek income, and achieve long-term growth. These goals, of course, need to be built on a solid foundation: the “core” of a portfolio. The idea of the core is to establish the right mix of exposures and investments, at an attractive price point, that seek to drive value over the long term.

With over 5,000 ETFs to choose from, building your core with ETFs does require a framework. Institutional investors have extensive due diligence processes for selecting investment products and in many cases, a whole staff to do the work. Based on my extensive work with institutions I propose using a simplified approach when selecting ETFs for the core of your portfolio.  Here are the five key questions you should be asking:

1.     Provider – How well do you know your provider?
Consider both the ETF provider’s experience in the ETF market, as well as the provider’s size, scale, track record and level of commitment to the ETF industry and to managing exposures versus  a rule or an index.  Different ETF providers have different investment philosophies. Importantly, your ETF provider should offer value add services, including a user-friendly web site with tools to help you build your core. For example, iShares utilizes the interactive Core Builder tool to help investors navigate possible ways to achieve this objective.

2.     Exposure – Can you get the exposure you want?
ETFs, even within a particular asset class or segment of the market, can vary significantly. Pay attention to the index and ask your financial advisor questions about differences between products and its ability to track a core index or benchmark. Understand the exposure you want and ensure the ETF you select is capturing that.

3.     Structure – Are there risk & cost implications from the ETF structure?
Look for ETFs whose product design balances desired exposure with cost and tax efficiency, as well as liquidity. In general, the ETF structure can help minimize the unintended tax consequences.  Generally speaking, ETFs tend to have lower turnover relative to actively managed funds, which can help minimize annual capital gains taxes.

4.     Liquidity – Can you trade when you need to?
Because ETFs trade on exchange, liquidity is a huge factor in why many investors utilize them.  Even for core holdings, which are by definition more long-term in nature, you still want to ensure you have the ability to trade when it’s time to dial up or down your exposure. However, be sure to examine the liquidity of the ETF itself, as well as liquidity of underlying securities.  

5.     Costs – What is the total cost of ownership?
Expense ratios are important, however all implicit costs including trading and market impact, should be factored in. Your financial advisor can help you estimate the impact of your trade before it’s placed.

———————————————————————————————————————————

Capital Gains Taxes: A type of tax levied on capital gains incurred by individuals and corporations. Capital gains are the profits that an investor realizes when he or she sells the capital asset for a price that is higher than the purchase price. Capital gains taxes are only triggered when an asset is realized, not while it is held by an investor. An investor can own shares that appreciate every year, but the investor does not incur a capital gains tax on the shares until they are sold.
Carefully consider the Funds’ investment objectives, risk factors, and charges and expenses before investing. This and other information can be found in the Funds’ prospectuses or, if available, the summary prospectuses which may be obtained by visiting www.iShares.com or www.blackrock.com. Read the prospectus carefully before investing.
Investing involves risk, including possible loss of principal.
The Funds are distributed by BlackRock Investments, LLC (together with its affiliates, “BlackRock”).
The strategies discussed are strictly for illustrative and educational purposes and should not be construed as a recommendation to purchase or sell, or an offer to sell or a solicitation of an offer to buy any security. There is no guarantee that any strategies discussed will be effective. The information provided is not intended to be a complete analysis of every material fact respecting any strategy. The examples presented do not take into consideration commissions, tax implications or other transactions costs, which may significantly affect the economic consequences of a given strategy. Diversification and asset allocation may not protect against market risk.
There can be no assurance that an active trading market for shares of an ETF will develop or be maintained.
©2014 BlackRock. All rights reserved. iSHARES and BLACKROCK are registered trademarks of BlackRock. All other marks are the property of their respective owners. iS-12782.

The posts on this blog are opinions, not advice. Please read our Disclaimers.