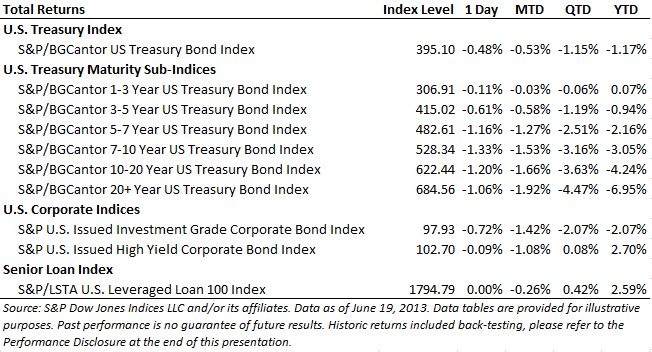
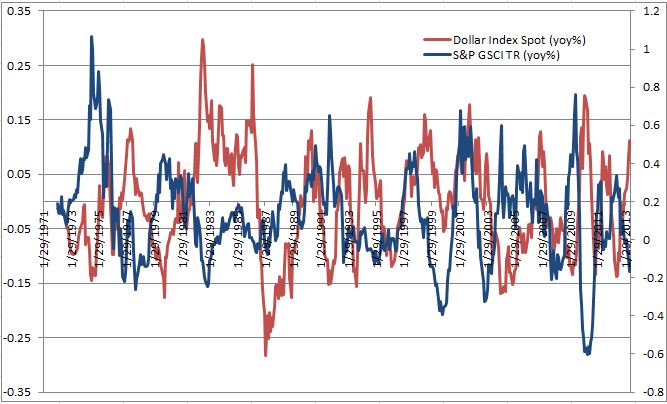
All commodities in the S&P GSCI and the DJ-UBS CI crashed on June 20, 2013, losing 3.1% and 3.0%, respectively, after the Fed declared the U.S. economy was expanding strongly enough for the central bank to begin slowing the pace of its bond-buying stimulus later this year. This is generally bad news for commodities since historically as the U.S dollar strengthens, goods priced in dollars become more expensive for other currencies. The historical negative relationship between the U.S. dollar and the S&P GSCI is shown below.
In addition to the generally inverse relationship between the U.S. dollar and commodities, there may be another overbearing consequence to the quantitative easing, reducing the incentive of the risk-specialists to fill the needs of commercial hedgers. It is based on the systematic response to whether the monetary policy works or does not work. In other words, the “Risk On – Risk Off” behavior of this market may be dominating individual commodities fundamentals, like the unexpected inventory rise of crude oil.
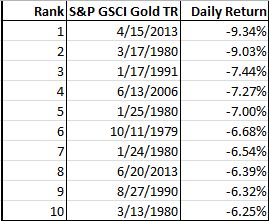
Thursday was a day where it seemed the “Risk-Off” was overshadowing fundamentals. The S&P GSCI and DJ-UBS CI Gold, Silver, Coffee, and Nickel, fell 6.4%, 8.3%, 4.8% and 3.5%, respectively for the day, and each are now bear markets for 2013. The S&P GSCI Gold, which recorded its biggest daily loss ever on April 15, 2013 of -9.3%, has not had two single day losses of this magnitude in the same year since 1980.
The posts on this blog are opinions, not advice. Please read our Disclaimers.