Get Indexology® Blog updates via email.

In This List

S&P U.S. Indices Mid-Year 2023: Analyzing Relative Returns to CRSP

Innovating for Insurance: S&P 500 Duo Swift Index

The Case for Timber

S&P U.S. Indices H1 2023: Analyzing Relative Returns to Russell

Getting to Know the Dow Jones U.S. Select Insurance Index

S&P U.S. Indices Mid-Year 2023: Analyzing Relative Returns to CRSP

Contributor Image
Cristopher Anguiano

Senior Analyst, U.S. Equity Indices

S&P Dow Jones Indices

Following a challenging 2022, H1 2023 hosted a recovery among U.S. equities: the S&P 500® (up 16.9%) posted its fourth-best first half since 1996, and there were gains across the market cap spectrum. But on a relative basis, and in contrast to longer horizons, the S&P Core U.S. Equity Indices lagged their CRSP counterparts in H1 2023 (see Exhibit 1).

The informed reader knows that 2023 has been a strong year for mega caps and Information Technology companies. Indeed, the S&P 500 Information Technology (42.8%) and S&P 500 Top 50 (27.6%) posted their best first-half performance since 1996 (see Exhibit 2). Given that S&P DJI’s indices benefited from having less exposure to Information Technology in 2022, one might expect this helped to explain relative performance in H1 2023.

Exhibit 3 demonstrates that the S&P 500’s relative performance in H1 2023 was hindered by its lower weight in Information Technology. The Brinson attribution results show that less exposure to the Information Technology sector contributed negatively to the S&P 500 (-0.6%). Combined with the negative selection effect in Information Technology (-0.6%)—the S&P 500 and the CRSP US Mega Cap Index (as represented by the Vanguard Mega Cap Index Fund as a proxy) have different constituents owing to differences in index construction—likely around 50% of the S&P 500’s underperformance was attributed to Information Technology.

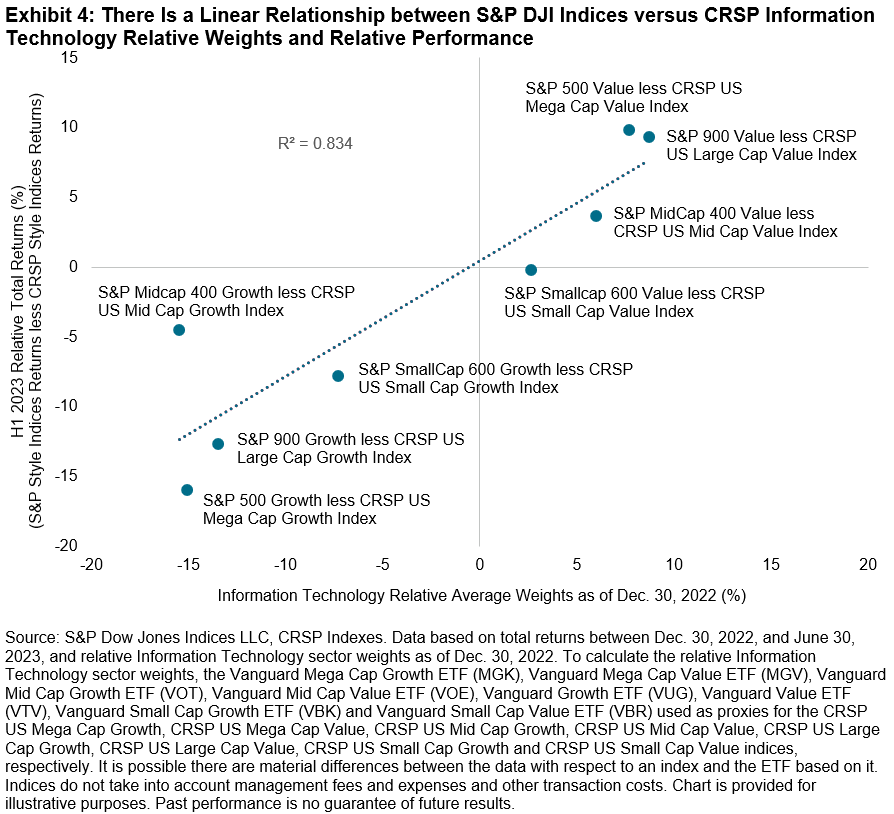
The consequences of Information Technology weight were even more apparent across style indices: Exhibit 4 shows that S&P Style Indices with more (less) exposure to Information Technology out- (under-) performed their CRSP counterparts in H1 2023. For example, the S&P 500 Value and S&P 900 Value posted their best relative H1 returns over the last 10 years, beating their CRSP counterparts by 9.9% and 9.3%, respectively. Conversely, the S&P 500 Growth and S&P 900 Growth posted their worst relative H1 returns over the same period, lagging their CRSP counterparts by 15.9% and 12.6%, respectively. Various CRSP index-based ETFs are used as proxies for the CRSP indices below.

The first half of 2023 once again highlighted the importance of index construction when assessing index characteristics, given different exposures can help to explain performance differences between indices with similar sounding objectives.

The posts on this blog are opinions, not advice. Please read our Disclaimers.

Innovating for Insurance: S&P 500 Duo Swift Index

How is intraday volatility rebalancing helping new multi-asset indices rapidly respond to changing markets? Look inside the S&P 500 Duo Swift Index, a diverse, multi-asset, risk-controlled index that is dynamic by design.


The posts on this blog are opinions, not advice. Please read our Disclaimers.

The Case for Timber

Contributor Image
Srineel Jalagani

Senior Director, Thematic Indices

S&P Dow Jones Indices

Timber is an essential resource and a genuine building block of human civilization. Its use in building construction and as a fuel source have made it integral to the functioning of our societies and world economy. On the flip side, our dependence on timber, combined with a lengthy regeneration time, means we are steadily using up this valuable resource. In the pre-industrialized world, forests covered more than 50% of habitable land.1 Today, our growing demand for this resource has reduced this coverage to less than 40%.

Trading of timber-linked products has seen massive growth in the past decade.2 This appetite for timber is expected to grow even more in the coming decade.3 Although residential demand remains the key driver for timber, other use cases like paper, packaging, plywood, etc., support demand diversity for timber.4

Investing in Timber

Timber is a real asset and investing in it typically involves ownership of the land on which the lumber-producing trees grow. Timber, being a physical asset, provides your typical inflation protection component, but, unlike many other real assets, has the unique feature of biological growth during times of volatility and depressed demand.5 The option of flexible timing of harvests during low demand can smooth out some of the price volatility of timber investments. Estimates put nearly 60% of the forestlands in the U.S. as privately owned.6

Capital allocation to lumber producing forestlands has traditionally been within the realm of large institutional investors that directly own the forestlands and can use intermediaries (e.g., Timberland Investment Management Organizations [TIMOs]) to manage these lands. Expertise in forestry and land management, combined with relatively long hold-up periods and illiquidity, have been leading drivers for active management of these assets. However, Timberland REITs bring the same expertise in management of timberlands and are publicly traded, providing relative liquidity, real-time pricing and transparency for these long-dated assets. Additionally, ETFs also provide another avenue of access to timber and related investments via publicly traded instruments.

The push toward sustainability as an investment goal adds another dimension to timber’s value in a diversified portfolio. Efficient water/soil/resource management, ecosystem/biodiversity preservation and positive climate impact all contribute to favorable environmental and sustainability objectives. Forests act as a carbon sequestration mechanism, and when timber from these forests is used in construction, this can further reduce GHG emissions.7

Indexing Approach to Timber-Related Investments

The S&P Global Timber and Forestry (GTF) Index, launched in 2007, targets exposure to timber-related investments via public equity stocks across developed market listings and local listings from three emerging market countries (Brazil, South Korea and South Africa).

S&P GTF Index constituents span the value chain of the timber ecosystem. To capture a broad investable stock group with thematic relevance, the starting universe of stocks includes firms from Timber REITS under the GICS® classification,8 along with firms whose revenue comes from segments relevant to the forestry business (using the FactSet Revere Business Industry Classification System).

An exposure score framework is applied over this group of stocks to maintain the index’s thematic purity. Firms with higher exposure scores are generally seen as being closer to the core of the timber producing and processing ecosystem. Timber REITs and Timber Property Management stocks are given a higher exposure score, along with pulp mills that can be vertically integrated, when compared to Paper Mills and Packaging Products related companies that are more downstream. The index constituents’ weights are based on each stock’s exposure score and its float market capitalization, subject to appropriate constraints to avoid concentration risk.

Additionally, the index methodology excludes companies that are engaged in certain business activities (e.g., controversial weapons, tobacco products, etc.) and companies that are non-compliant with the United Nations Global Compact (UNGC) guidelines, and it screens companies for any reputational risk concerns.

As of Aug. 30, 2023, the index consists of 30 stocks, with 43% weight allocated to 11 pure-play companies, 16% weight in Timber REITs stocks and 27% weight to the companies with an exposure score of 1.

The index is tilted (56%) toward mid-cap stocks (see Exhibit 2), with the majority (over 40%) of the exposure coming from North American entities, followed by European firms (33%).

1 https://www.visualcapitalist.com/visualizing-the-worlds-loss-of-forests-since-the-ice-age/

2 https://www.worldwildlife.org/industries/timber

3 https://www.marketwatch.com/press-release/forestry-and-logging-market-2023-to-2029-projected-to-flourishing-hancock-victorian-plantations-weyerhaeuser-scottish-woodlands-tilhill-forestry-2023-06-16

4 https://caia.org/blog/2023/02/25/exploring-link-between-lumber-prices-and-timber-markets

5 https://www.ipe.com/inflation-assets-timber/37666.article

6 https://cdnsciencepub.com/doi/10.1139/cjfr-2021-0085

7 https://www.fs.usda.gov/research/treesearch/63853

8 For further information please see the S&P Thematic Indices Methodology.

The posts on this blog are opinions, not advice. Please read our Disclaimers.

S&P U.S. Indices H1 2023: Analyzing Relative Returns to Russell

Contributor Image
Fei Wang

Senior Analyst, U.S. Equity Indices

S&P Dow Jones Indices

After a challenging year in 2022, the U.S. equity market saw a strong turnaround in the first half of 2023, with the S&P 500® up 17% since year-end 2022. Exhibit 1 shows that the rebound was also observed across the cap spectrum. Returns in the second quarter outperformed the first quarter after the market shook off regional bank concerns earlier this year.

The S&P Core Indices generally underperformed their Russell counterparts in H1 2023. The large- and small-cap indices, in particular, saw relatively large differences. For instance, the S&P 500 underperformed the Russell Top 200 by 2.53% in H1 2023, its second largest H1 underperformance since 1995, only 2020 was larger (-2.59%).

The S&P 500’s underperformance appears to have been largely driven by having less exposure to Information Technology, which has been running hot so far this year. But there were other possible considerations further down the cap spectrum. For example, the S&P SmallCap 600®’s H1 2023 underperformance may have been driven by the choice of constituents—particularly in Health Care and Financials—rather than differences in sector exposures (see Exhibit 3). The different drivers of relative performance across the cap spectrum have once again demonstrated the importance of index construction and potential impact of stock selection and size exposures.

There was also elevated divergence among style indices in H1 2023. The S&P Value Indices outperformed their Russell counterparts across the cap spectrum, while the S&P Growth Indices underperformed. Notably, the S&P 500 Style Indices posted the largest H1 performance differentials compared to Russell counterparts since 1995—the S&P 500 Value outperformed the Russell Top 200 Value by 7.2%, while the S&P 500 Growth underperformed by 10.9%.

Relative exposure to Information Technology helped to explain the relative performance between S&P DJI and Russell Style Indices. Indeed, Exhibit 5 shows that style indices with higher exposure to the Information Technology sector outperformed in H1 2023. This was particularly the case given that S&P DJI’s December 2022 style reconstitution led to some sector shifts: S&P 500 Value (Growth) had more (less) exposure to Information Technology sectors than its Russell counterpart. Various Russell index-based ETFs are used as proxies for the Russell indices below.

The first half of 2023 saw a recovery among U.S. equities. Information Technology exposure was important in explaining the relative performance of the S&P 500 and S&P Style Indices compared to their Russell counterparts. But stock selection and the size factor also played a role in mid- and small-cap indices. Once again, such performance differences highlight the importance and potential impact of index construction.

1 We used the following ETFs as proxies for the Russell indices: iShares Russell Top 200 Growth ETF, iShares Russell Top 200 Value ETF, iShares Russell MidCap Growth ETF, iShares Russell MidCap Value ETF, iShares Russell 2000 Growth ETF, iShares Russell 2000 Value ETF, iShares Russell 1000 Growth ETF and iShares Russell 10000 Value ETF.


The posts on this blog are opinions, not advice. Please read our Disclaimers.

Getting to Know the Dow Jones U.S. Select Insurance Index

Contributor Image
Sherifa Issifu

Senior Analyst, U.S. Equity Indices

S&P Dow Jones Indices

The global insurance market capitalization has grown significantly over the past three decades, growing from nearly USD 350 billion at the end of 1992 to USD 2.7 trillion as of H1 2023. This growth was accompanied by a shift in global leadership. For example, Exhibit 1 shows that European insurance companies made up a greater proportion of the insurance market than their U.S. counterparts in the early 1990s. Nowadays, the U.S. accounts for the majority of the market capitalization, while Europe’s weight has diminished.

The Dow Jones U.S. Select Insurance Index captures an investable portion of the world’s largest insurance market. As with other indices in the Dow Jones U.S. Select Sector Speciality Index Series, the index is designed to measure the performance of selected subsectors of the Dow Jones Industry Classification System (DJICS). Constituents must also meet liquidity and market capitalization thresholds. The index uses a float-adjusted market capitalization (FMC) weighting scheme with some high-level diversification capping rules applied and is rebalanced quarterly in March, June, September, and December.1

The Dow Jones U.S. Select Insurance Index comprises stocks from the Dow Jones U.S. Broad Stock Market Index that are classified under DJICS as Full Line Insurance, Property & Casualty Insurance and Life Insurance, and excludes companies whose principal business activities are classified as Reinsurance and Insurance Brokers. Exhibit 2 shows that Property & Casualty Insurance is the primary subsector, making up 67% of the index as of June 30, 2023, followed by Life Insurance at 24% and Full Line Insurance as the smallest slice at just 10%.

Insurance companies are typically considered non-cyclical or “defensive” given that the products and services provided by insurance companies are often needed regardless of the phase of the business cycle. The historical performance of the Dow Jones U.S. Select Insurance Index appears to reflect this perspective.

Exhibit 3 shows that, while the Dow Jones U.S. Select Insurance Index posted similar performance to the Dow Jones U.S. Broad Market Index since the end of 1991 (an annualized 9.5% vs 9.9%, respectively), the insurance index outperformed in turbulent environments. For example, the broad market declined by 19% in 2022, while the Dow Jones U.S. Select Insurance Index gained 12%, outperforming by 31%. In H1 2023, the insurance index underperformed, as tech stocks propelled the market higher.

The Dow Jones U.S. Select Insurance Index typically had a lower trailing 12-month P/E ratio than the Dow Jones U.S. Broad Stock Market Index, meaning market participants typically paid less for every dollar of earnings received. The index also had a moderately higher realized dividend yield than the Dow Jones U.S. Broad Market Index, showing that insurance companies paid more dividends relative to their share price.

1 For further details, please see the Dow Jones U.S. Select Sector Speciality Indices Methodology.

The posts on this blog are opinions, not advice. Please read our Disclaimers.