Get Indexology® Blog updates via email.

In This List

The Risk/Return Tradeoff: Results from the SPIVA South Africa Year-End 2022 Scorecard

Tracking Quality Dividend Growers in Pan Asia

Revenue-Weighted Indices: An Alternative to Core Equities

What Drives S&P 500 Rebalance Turnover?

A Year of Two Halves for Australian Large-Cap Equity Managers

The Risk/Return Tradeoff: Results from the SPIVA South Africa Year-End 2022 Scorecard

Contributor Image
Joseph Nelesen

Senior Director, Index Investment Strategy

S&P Dow Jones Indices

The year 2022 was riddled with investment challenges worldwide, as fears of recession, rising inflation and geopolitical uncertainty ranked among a whirlwind of other market pressures. In South Africa, these risks manifested in two notably different halves of the year, with major equity and bond indices ending H1 in negative territory, but then rallying to recover in H2 (see Exhibit 1). The SPIVA® South Africa Year-End 2022 Scorecard assesses the aftermath and reveals how many active managers successfully navigated the 12-month rollercoaster of risk.

Although many actively managed South Africa Equity funds started the year strong—with only 36% underperforming the S&P South Africa 50 Index at the end of H1—most lost their advantage by the end of 2022, as 61% of South Africa Equity funds finished 2022 as underperformers relative to the benchmark (see Exhibit 2).

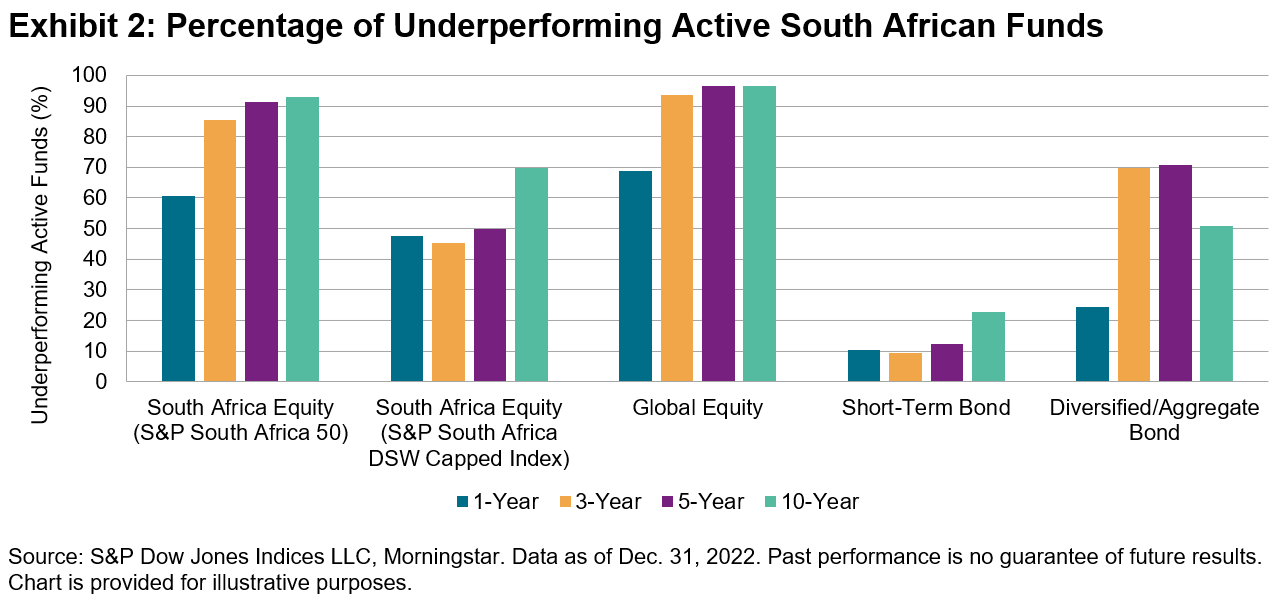
Our South Africa Scorecard (unusually) offers two comparison benchmarks for the domestic equity category, reflecting the differing opportunity set for foreign-investment-constrained fund managers versus those managers with fewer constraints. Consistent readers of SPIVA South Africa might observe that 2022 was the fifth year in a row that less than half of South Africa Equity managers underperformed the S&P South Africa Domestic Shareholder Weighted (DSW) Capped Index, but the eighth consecutive year in which more than half underperformed the S&P South Africa 50 Index. These differences emphasize the importance of benchmark selection in evaluating active performance. It is perhaps worth highlighting that, nonetheless, most active funds underperformed either benchmark over a 10-year horizon (see Exhibit 2).

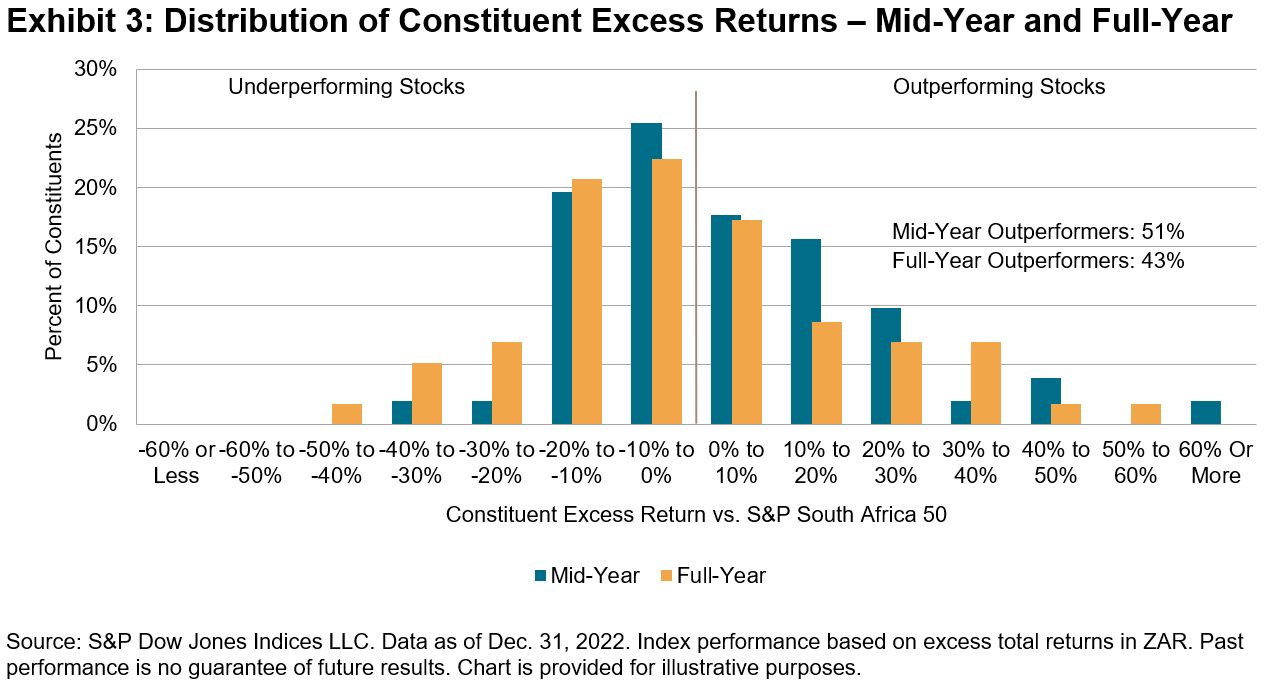
The changing rate of underperformance from H1 to H2 seems to have mirrored similar changes in the challenge of stock selection: although 51% of stocks in the S&P South Africa 50 Index outperformed the index itself through the end of H1, by the end of the year, only 43% of stocks had a higher return than the index (see Exhibit 3).

Among other notable highlights from this year’s reports, Short-Term Bond funds caught the eye with a commendably low 12.5% underperformance rate. This was the fifth year in a row that 20% or fewer of Short-Term Bond fund managers underperformed the STeFI Composite on an absolute return basis. However, the dramatic increase in the underperformance rate to 83% using risk-adjusted returns suggests managers may be generating their outperformance from higher-risk securities.

Adding risk brought added return for some managers in 2022. Only time will tell whether such approaches result in persistent success in 2023 and beyond.

The posts on this blog are opinions, not advice. Please read our Disclaimers.

Tracking Quality Dividend Growers in Pan Asia

What does it take to become an S&P Pan Asia Dividend Aristocrat? S&P DJI’s Rupert Watts and KraneShares’ Brendan Ahern explore how the index tracks quality dividend growers in Pan Asia and a range of potential applications for these defensive yield generators.

The posts on this blog are opinions, not advice. Please read our Disclaimers.

Revenue-Weighted Indices: An Alternative to Core Equities

Contributor Image
Wenli Bill Hao

Director, Factors and Dividends Indices, Product Management and Development

S&P Dow Jones Indices

As persistently high inflation, high interest rates and geopolitical risks continue to dominate the macro environment, the S&P 500® Revenue-Weighted Index, S&P MidCap 400® Revenue-Weighted Index and S&P SmallCap® 600 Revenue-Weighted Index have outperformed their corresponding float-adjusted market-capitalization (FMC) weighted indices by more than 5% during the past one-year period (see Exhibit 1). In this blog, we will analyze the revenue-weighted index methodology, the short- and long- term performance, style tilts and sector composition.

Methodology Overview

As alternatives to the FMC-weighted indices, the S&P 500, S&P MidCap 400 and S&P SmallCap 600 Revenue-Weighted Indices are weighted by constituents’ revenues from the past four quarters. In order to provide broader coverage and reduce concentration risk, individual constituents’ weights are capped at 5%. Lastly, these indices are rebalanced quarterly in March, June, September and December.

The revenue-based index may be a better reflection of the broader economy, as revenue is directly tied to economic activity. Moreover, revenue is a direct indicator of a company’s ability to generate income and is less susceptible to accounting manipulations.

Short- and Long-Term Outperformance

Historically, the revenue-weighted indices outperformed their corresponding FMC-weighted indices for all periods studied, in the short and long term, in terms of both total returns and risk-adjusted returns (see Exhibit 2).

Factor Exposure

In Exhibit 3, the revenue-weighted indices demonstrated a value tilt versus their respective benchmarks. In terms of Axioma Risk Model Factor Z-scores, the revenue-weighted indices had higher exposure to the book-to-price ratio, comparable exposure to earnings yield and lower exposure to growth factors. The value tilt has proved beneficial in the recent rising interest rate environment. Holding all else equal, value stocks offered relatively more protection in a rising interest rate environment compared with growth stocks, due to their lower durations.

Furthermore, all three revenue-weighted indices showed comparable or slightly higher profitability, lower momentum and smaller size tilt than their corresponding FMC-weighted indices.

Sector Composition

Exhibit 4 shows the historic sector exposure difference between the revenue-weighted indices versus their benchmarks. The revenue-weighted indices overweighted Consumer Discretionary, Consumer Staples and Industrials, while having an underweight in Financials, Information Technology and Health Care.

Conclusion

Weighted by constituents’ revenues over the previous four quarters, the S&P 500 Revenue-Weighted Index, S&P MidCap 400 Revenue-Weighted Index and S&P SmallCap 600 Revenue-Weighted Index have historically provided consistent total returns and risk-adjusted outperformance over both short- and long-term periods. The revenue-weighted indices also showed value tilt in comparison with their corresponding benchmarks.

The posts on this blog are opinions, not advice. Please read our Disclaimers.

What Drives S&P 500 Rebalance Turnover?

Contributor Image
Hamish Preston

Head of U.S. Equities

S&P Dow Jones Indices

The S&P 500® undergoes quarterly updates—more colloquially known as rebalances—after the close of the third Friday in March, June, September and December. These updates typically affect the S&P 500’s composition and have turnover implications for investors tracking the index. For example, Exhibit 1 shows the S&P 500 turnover at each rebalance between March 1995 and March 2023. The S&P 500 rebalance typically affected around 0.8% of the index’s market capitalization.

Importantly, rebalance turnover is not driven primarily by constituent changes in the S&P 500: around 90% of S&P 500 constituent changes since 1995 did not happen at a quarterly rebalance (see Exhibit 2). Unlike many other indices, S&P 500 constituent changes are made on an ongoing, as-needed basis to maintain the index’s 500 company count and to ensure the S&P 500 continues to meet its stated objective of measuring the large-cap U.S. equity segment.

Although some constituent changes do happen at rebalances—for example, Fair Isaac & Co replaced Lumen Technologies at the March 2023 rebalance—the off-rebalance timing of many constituent changes is driven by the fact that most S&P 500 deletions are caused by events that affect companies’ eligibility for ongoing index membership. These events include M&A activity, spinoffs, restructurings and companies entering Federal Deposit Insurance Corporation (FDIC) receiverships (e.g. here and here).

Instead, quarterly updates to company-specific information typically had a far bigger impact on S&P 500 rebalance turnover than constituent changes. Exhibit 3 separates the figures shown in Exhibit 1 into turnover caused by constituent changes versus turnover caused by updates to company-specific information. On average, the latter accounted for 90% of the quarterly rebalance turnover. These company-specific updates capture the impact on constituents’ market capitalizations from company actions such as mergers and acquisitions. And since the S&P 500 became free-float adjusted in 2004-2005, the company-specific changes also reflect updates to the proportion of a given company’s shares that are available to investors.

Overall, the S&P 500 rebalances offer quarterly updates that help the index meet its stated objective. But unlike other indices, constituent changes did not typically drive S&P 500 rebalance turnover: the ongoing, as-needed constituent changes typically occurred off-rebalance, as many deletions were driven by events affecting companies’ index eligibility. Instead, updates to company-specific information usually drove rebalance turnover.

The posts on this blog are opinions, not advice. Please read our Disclaimers.

A Year of Two Halves for Australian Large-Cap Equity Managers

Contributor Image
Benedek Vörös

Director, Index Investment Strategy

S&P Dow Jones Indices

The first half of 2022 brought steep and broad-based losses for Australian equity indices of all stripes. On a relative basis, however, active Australian Equity General funds had a decent start to 2022; as our SPIVA® Australia Mid-Year 2022 Scorecard reported, a (slim) majority of active managers in this category outperformed the S&P/ASX 200. Unfortunately for their investors, good times for active domestic large-cap funds didn’t continue into the second half of the year. While the recovery in Australian equities in H2 2022 ensured a positive return for Australian Equity General funds across all quartiles on an absolute basis, over three-quarters of them failed to beat the S&P/ASX 200, bringing the full-year underperformance rate to 58%.

One of the challenges faced by active managers in H2 was the nearly identical performance of the major equity segments: while equal weight, value, growth, mid caps, small caps and the largest of blue chips all had distinct return patterns in H1, their gains were almost indistinguishable in H2.

As Exhibit 2 shows, the near uniformity of equity returns in H2 was reflected in the relatively narrow range over which active Australian Equity General returns were scattered: their interquartile range was just 3%, less than half the 7% seen in H1. It is also noteworthy that, in H2 2022, even funds in the top quartile would have lagged the benchmark. Given the changing market environment over the year, it might be no surprise that few active managers were able to adapt and navigate the churning winds: historical evidence suggests that it is hard to find active managers who are able to beat the market persistently

Overall, the market conditions of 2022 offered a particularly interesting test for the proponents of active management. A global equity downturn gave those who could play “defense” a chance to shine, while the relative performances of different market segments offered plenty of opportunity for outperformance. While it cannot hope to settle the debate, the SPIVA Australia Scorecard brings transparent and objective assessments of active fund performance, using industry-standard benchmarks to better inform investors about where active management has been “working” over short- and long-term periods. Overall, the year-end 2022 scorecard showed a “game of two halves” for active managers in broad Australian equities—with a good H1 followed by a challenging H2—and emphasized the challenge of persistent outperformance in rapidly evolving market environments.

The posts on this blog are opinions, not advice. Please read our Disclaimers.