Get Indexology® Blog updates via email.

In This List

Leadership of Canadian Value Indices

Taking Higher Interest Rates in STRIDE

Spotlight on Commodities: Inflation and Innovation

Making a Virtue of Necessity

Will Diwali Light Up Demand for Gold in the Fourth Quarter?

Leadership of Canadian Value Indices

Contributor Image
Hector Huitzil

Analyst, Global Equity Indices

S&P Dow Jones Indices

Introduction

How have value- and growth-oriented strategies performed in the Canadian equity market in recent years, especially given the recent resurgence in value-oriented companies?

Value investing is recognized as a well-known strategy that seeks to benefit from strength in fundamental characteristics of securities that might not be completely reflected in market prices, and it typically contrasts with growth strategies.

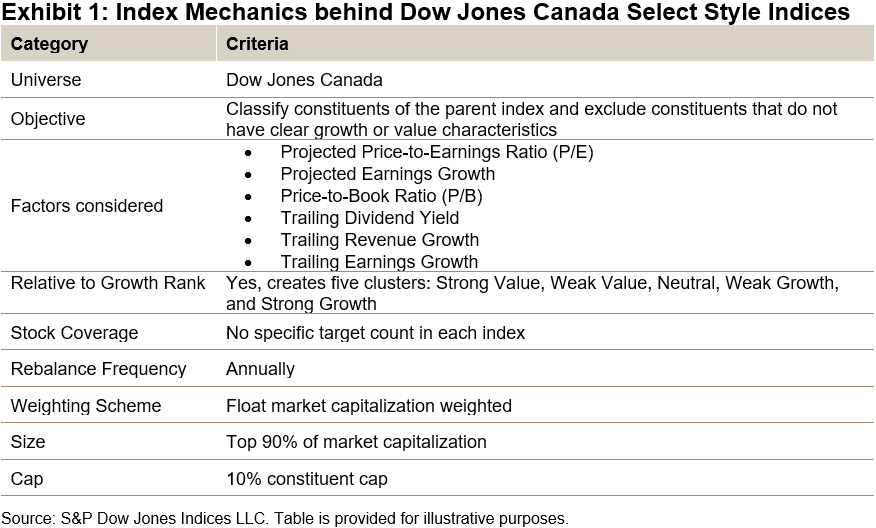
For this blog, we examine the value and growth implementation used by the Dow Jones Canada Select Style Indices, which use six metrics to determine style characteristics: two projected, two current, and two historical to classify each constituent, while small-caps are excluded altogether.

Constituent Characteristics and Recent Returns

Sector exposures for each style index contrast considerably from each other and the Canadian equity market as measured by the S&P/TSX 60. Exhibit 2 displays typical sector weights and a color scale that represents the intensity of exposure. While the S&P/TSX 60 has significant weights in the Financials and Energy sectors, the value index is exposed to these sectors primarily, and the growth index has heavier exposure to firms in the Industrials and Information Technology sectors. The growth index tends to capture a greater number of constituents and overall smaller total market capitalization than its value counterpart due to the fundamentals of the market segment. This leads to smaller size tilts in its exposure, although small-cap constituents are mainly excluded from the index universe.

These differences in sector exposure provide some insight into historical index performance. Returns of the Value index exceeded returns of its Growth counterpart and the S&P/TSX 60 over the past two years. During this time, the largest sectors within the Value index—Financials and Energy—were the best performing in the Canadian market, while the heaviest sector in the Growth index—Industrials—had only middling performance during the period and its second-largest sector was the main laggard in the Canadian market and contributed the most to the underperformance.

Exhibit 3 presents the cumulative returns for both indices and the broader Canadian market for the 20-year period, while Exhibit 4 presents the difference between rolling 12-month returns for the Value and Growth indices. A positive number in Exhibit 4 indicates outperformance in the 12-month returns by the Value index.

Over the 20-year period, the differences in performance translated into a cumulative return by the Value index that was 13% higher than the Growth index and 24% above the S&P/TSX 60. The most recent outperformance by the Value index started in 2021 and reached a magnitude not seen since 2009. This difference has translated into a higher cumulative gain than its counterpart and the Canadian benchmark.

Conclusion

Over the past two years, the Dow Jones Canada Select Value Index has outperformed its Growth counterpart and the broader Canadian equity market, while longer historical periods have also favored value. Market participants aiming to incorporate the value and growth factors may benefit from understanding the constituent selection process, index composition characteristics, and resulting historical returns of the Dow Jones Canada Select Style Indices.

The posts on this blog are opinions, not advice. Please read our Disclaimers.

Taking Higher Interest Rates in STRIDE

Contributor Image
Fei Mei Chan

Former Director, Core Product Management

S&P Dow Jones Indices

When it rains, it pours, and there’s no lack of bad news in 2022. The equity market is in solid bear territory, with the S&P 500® down 22% YTD. Inflation is high, and the Federal Reserve has aggressively hiked interest rates in recent months. The latest cycle of rate increases has happened faster than at any time since 1988. Rates have increased in both nominal and real (inflation-adjusted) terms. The current real yield curve sits significantly higher than at its most recent trough in July 2020.

Higher interest rates are often perceived to be bad for equity performance. Although it doesn’t always work out that way, this year, that prediction has come to fruition. Poor equity returns, other things being equal, are unpleasant for investors’ retirement portfolios. But generating returns is just one aspect of providing retirement security. An equally important aspect is to convert those cumulative returns into a sustainable, inflation-adjusted income stream. The S&P STRIDE Index Series is designed to facilitate both income generation and preserve purchasing power.

Targeting a dollar value of portfolio assets by retirement is aspirational. But budgeting for a stream of consumption costs post-retirement is actionable. The S&P STRIDE Series indicizes retirement income plan structures traditionally offered by annuities or defined benefit plans. Income costs are discounted back to today’s value using real interest rates. Higher rates imply lower costs of generating retirement income.

Our quarterly S&P STRIDE Dashboard provides regular updates on changes in the cost of retirement income. Exhibit 2 shows the cost for a dollar of retirement income for each of the 13 vintages that the S&P STRIDE Indices track.

Since real interest rates have risen dramatically in the past year, the cost of retirement income has declined significantly (lowest since 2015), particularly for longer-maturity vintages.

Additional resources:

Introducing the S&P STRIDE Index Series

Making STRIDEs in Evaluating the Performance of Retirement Solutions

The posts on this blog are opinions, not advice. Please read our Disclaimers.

Spotlight on Commodities: Inflation and Innovation

What could the convergence of inflation and interest rate tightening mean for commodities? CME Group’s Blu Putnam takes a fundamental look at global commodity markets with S&P DJI’s Jim Wiederhold and Kelsey Stokes.

The posts on this blog are opinions, not advice. Please read our Disclaimers.

Making a Virtue of Necessity

Contributor Image
Craig Lazzara

Former Managing Director, Index Investment Strategy

S&P Dow Jones Indices

When the market declines by nearly 24%, as the S&P 500® did in the first nine months of 2022, investors typically lick their wounds and wonder what comes next. Spoiler alert: I don’t know. But there are ample historical data to explore amidst our befuddlement.

First, the bad news: Exhibit 1 shows that there is very little relationship between trailing returns and future returns. These data comprise every nine-month period since 1971, not just the January-September intervals; the exact correlation between the last nine months’ returns and the next nine months’ returns is 0.006. A statistician’s best guess of the next nine months’ returns would simply reflect the median return of the series, ignoring whatever the last nine months’ returns had actually been.

But there’s good news hidden within Exhibit 1. The market has no memory; the best guess of future returns does not depend on the immediate past.

Exhibit 2 shows this a bit more clearly. This exhibit groups our observations into deciles, based on trailing returns. The bottom decile thus contains the worst 10% of nine-month returns (including, we need hardly add, the first nine months of 2022). Over all nine-month periods in the last 50 years, the median return was 9.5%. When historical returns were in the bottom decile, the median return in the next nine months was 10.8%, a not-inconsiderable improvement over the global median.

Exhibit 3 gives us more detail on results after a bottom-decile experience; the median return in the subsequent 12 months is 16.6%, well above the unconditional median (14.0%).

Although these results are drawn from a full 50 years of data, we can draw similar conclusions if we limit ourselves to periods of relatively high inflation. The U.S. Consumer Price Index (CPI) rose above 6.0% in 1973 and remained elevated until 1982; after 1982, the CPI remained below 6.0% until this year. If we look only at those high inflation years, we see similar results, as Exhibit 4 illustrates.

Nothing in these data is certain, of course. After a bottom decile performance, the market might decline further, or might not rebound as much as is typical. Uncertainty is the investor’s constant companion, but historical data can at least give us some clues to the future. Bad returns occasionally come. But the fact that they have come in the last nine months does not make it more likely that they will come in the next nine months. Long-term investors should bear the long-term results in mind.

The posts on this blog are opinions, not advice. Please read our Disclaimers.

Will Diwali Light Up Demand for Gold in the Fourth Quarter?

Contributor Image
Jim Wiederhold

Former Director, Commodities and Real Assets

S&P Dow Jones Indices

During the Diwali festival in India, retail gold demand tends to pick up, offering a floor to global gold prices or the potential impetus to push prices seasonally higher. Several years of lower-than-expected gold demand suggest that there is room for an uptick in demand in Q4 2022 for India’s second-largest import by value. India plays a crucial role in the gold market, with global annual imports of gold moving back and forth between India and China as the biggest net importer.

Gold prices have moved lower over the course of 2022, as many central banks across the globe have embarked on rate hiking regimes in order to get control of inflation. Gold in India hit another new low, as the U.S. dollar continued to make new highs on the back of the U.S. Fed announcing one of the most aggressive rate hiking campaigns in decades. The Reserve Bank of India (RBI) also increased interest rates, but not as aggressively in comparison, given that inflation has risen but is not as high as in the U.S. Expectations are for the RBI to hike less in coming meetings, while the U.S. Fed could continue to increase rates at large clips, which could lead to further weakness in the short-term gold price, given it is historically negative correlation to the U.S. dollar.

There are potential tailwinds in the short term for gold outside of the demand from the Diwali festival. Gold has been known as an inflation hedge due to its use as a store of value. Recently, it has not held up to that claim; inflation has soared higher, while gold prices have lagged other commodities. If we look back historically to other high inflation periods in the 1970s and mid-2000s, gold tended to lag other commodities prices higher and usually did so in the second half of these high inflation time periods. Will this time echo those prior periods? It’s hard to say with other potential new stores of value present that were not available in past high inflation environments, like cryptocurrencies.

S&P Dow Jones Indices produces numerous gold-related indices, as well as multi-asset indices using gold futures as constituents. Check out our website for more information on our gold index offerings.

This article was first published in The Economic Times on Oct. 8, 2022


The posts on this blog are opinions, not advice. Please read our Disclaimers.