


Explore how a rules-based approach to tracking real estate companies in the S&P 500® impacts dividend yield and diversification.
The posts on this blog are opinions, not advice. Please read our Disclaimers.What’s Inside the Real Estate Select Sector?
Defensive Dynamics
The S&P Systematic Global Macro Index Outperformed YTD
Infrastructure to Strengthen a Portfolio in Volatile Times
Exploring the S&P 500 ESG Leaders Index – Goldilocks’ Choice of the S&P ESG Index Series
What’s Inside the Real Estate Select Sector?
- Categories Equities
- Tags ETFs, indexing real estate, indexing REITs, indexing sectors, real estate companies, real estate development, real estate investment trusts, real estate management, real estate sector, Real Estate Select Sector, S&P 500, S&P Dow Jones Indices, sector, sector diversification, Select Sector Indices, Select Sectors, U.S. equities, U.S. sectors
Defensive Dynamics

2022 has been a tumultuous year characterized by reversals, with the S&P 500® down 20% in the first six months of the year and rebounding by 9% in July. In this uncertain environment, seeking defensive exposures via sectors could mitigate portfolio risk, but a nuanced perspective may be required to understand which sectors offer the best defense.
As Exhibit 1 illustrates, over the past 12 months, Energy was not only the most volatile sector, but was also the most positive contributor to the S&P 500’s performance. Meanwhile, Information Technology, the largest of the S&P 500 sectors by weight, was a key detractor to the S&P 500’s performance and the third most volatile sector.
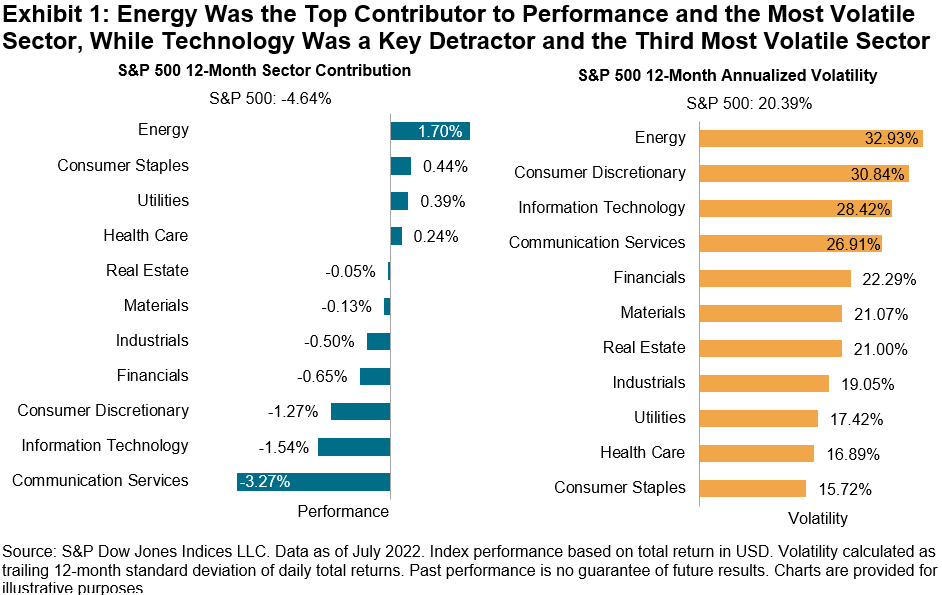
The impact of the Energy and IT sectors is particularly interesting to analyze due to the sectors’ different diversification properties. In Exhibit 2, we calculate the spread in trailing 12-month volatility between the S&P 500 versus S&P 500 Ex-Energy and the S&P 500 Ex-Information Technology, respectively. When this spread is positive, the inclusion of the sector increases volatility in the benchmark; when negative, the sector acts as a diversifier. Note the negative spread for Energy and positive spread for IT, over the most recent 12-month observation.

Digging deeper, Exhibit 3 plots the trailing 12-month correlations of the Energy and Information Technology sectors, respectively, with the S&P 500 excluding that sector. Consistent with the results of Exhibit 2, the correlation between S&P 500 Energy and S&P 500 Ex-Energy has declined in recent years. In contrast, the correlation between S&P 500 Information Technology and S&P 500 Ex-Information Technology, which has historically been positive, has increased recently. In other words, Energy’s performance has increasingly been divergent from the rest of the market’s, while IT’s performance has increasingly mirrored the remainder of the market.

While we can conclude that Energy has recently been acting as a defensive sector by mitigating market volatility and Information Technology as a cyclical play via risk enhancement, this hasn’t always been the case. For example, in 2008, during the depths of the financial crisis, these two sectors acted very differently, as adding Energy significantly increased market volatility, while adding IT decreased overall market volatility. In contrast, following the burst of the tech bubble in 2001, IT added substantially to market risk. Understanding that sectors’ defensive characteristics change over time is key to alleviating risk via sector allocation.
The posts on this blog are opinions, not advice. Please read our Disclaimers.
The S&P Systematic Global Macro Index Outperformed YTD

U.S. equities rebounded in July thanks to earnings from mega-cap technology and major oil companies. The S&P 500® surged 9.2%, posting its best month since November 2020 and reversing its 8.3% loss in June. Nevertheless, the S&P 500 remains in correction territory, down 13.1% from its Jan. 3, 2022, record high.
The S&P Systematic Global Macro Index (SGMI) has outperformed the equity market YTD. While the S&P 500 was down 12.6% YTD, the multi-asset trend following index rose 17.4%, similar to the average returns of commodity trading advisors (CTAs) as measured by the SG CTA Total Return Index. In the 12-month period, the SGMI outperformed the broad equity benchmark and the CTA index (see Exhibit 1).

The SGMI is designed to measure a trend-following strategy that takes a long, short or zero position in 37 constituents across six sectors (equities, fixed income, short-term interest rate, foreign exchange, commodities and energy). The trend signal for each constituent is evaluated and established individually via regression. Sectors and constituents are weighted so that they contribute equally to the index risk. The index uses leverage to achieve its 17.5% target volatility.
The SGMI is rebalanced monthly. Comparing its allocation in early August with that at the end of July, we can see the index is shifting from commodities to equities (see Exhibit 2). This is not surprising as it is designed to capture and respond to the latest trend in the market. The index continues to short government bonds but has scaled back the size of these short positions.

It remains unclear whether the market has completely shaken off concerns over inflation and rising rates. The S&P SGMI may help market participants seeking to ride market trends via a diversified multi-asset approach.
The posts on this blog are opinions, not advice. Please read our Disclaimers.Infrastructure to Strengthen a Portfolio in Volatile Times

Key Observations:
- Infrastructure owners and operators provide real asset exposure in inflationary environments
- Opportunities for yield on infrastructure continue to be relatively strong
- Infrastructure companies have delivered consistent operating margins over time
How can investors power through the rising inflation, low real yields and sluggish profits in today’s volatile markets? The answer may be pure-play infrastructure companies. By owning critical products and services, these companies can raise prices to offset inflation, pay reasonable dividends, and maintain consistent operating margins.
Fight Inflation Fears with Infrastructure
Inflation, as measured by the consumer price index (CPI), is at the highest level in 40 years,1 and New York Fed data on one‑year inflation expectations suggests that price increases could persist. Inflation can have an adverse impact on growth and profitability across many sectors, but owners of real, essential service assets like energy and water may buck the trend by increasing prices during inflationary times.
Going back to 2008, pure-play infrastructure has outperformed the S&P 500 in inflationary periods. When year-over-year inflation exceeded the average of 2.25%, 25 bps above the Fed target rate, the Dow Jones Brookfield Global Infrastructure Composite Index outperformed the MSCI ACWI Index by 1.1% and the S&P 500 by 0.4% monthly and 13% annually, on average.

Hungry for Yield
Finding yield has been challenging in the low interest rate environment since 2008. The addition of inflation has made this even more acute. Investors looking for yield may be skeptical of fixed income as the Fed starts increasing rates, since loss of principal could easily offset gains from interest. Further, high inflation erodes real rates of return. While fixed income is principal protected, there is no participation in economic growth.
Infrastructure companies often offer attractive yield and potential capital appreciation. Since 2014, infrastructure owners and operators have provided higher yield than the S&P 500 and the 10-year U.S. Treasury.

Consistent Performance Amidst Uncertainty
Uncertainty is rising as markets grapple with multiple headwinds. Many companies are facing margin compression and recent earnings results showed sales growing faster than earnings, reflecting pressure on operations.
Against this backdrop, investors may put a premium on consistency and stability. Infrastructure owners and operators typically have long-term agreements that help deliver consistent fundamental results. Operating margins are historically less volatile than the MSCI ACWI Index, S&P 500 and the S&P 500 Energy Index, providing some stability in uncertain times.

1 Source: U.S. Bureau of Labor and Statistics, “Consumer Price Index,” April 2022.
This information is not meant to be investment advice. There is no guarantee that the strategies discussed will be effective. Investment comparisons are for illustrative purposes only and not meant to be all-inclusive.
Any forward-looking statements herein are based on expectations of ProShare Advisors LLC at this time. ProShare Advisors LLC undertakes no duty to update or revise any forward-looking statements, whether as a result of new information, future events or otherwise.
Investing involves risk, including the possible loss of principal.
The posts on this blog are opinions, not advice. Please read our Disclaimers.Exploring the S&P 500 ESG Leaders Index – Goldilocks’ Choice of the S&P ESG Index Series

S&P Dow Jones Indices (S&P DJI) launched the S&P 500® ESG Leaders Index in February 2022. The index sits within our S&P ESG index offerings, which has been designed to offer different solutions to reflect the wide range of ESG index investment needs. Sustainable investing continues to gain traction for a multitude of reasons—one being a desire to align investments with investor values. However, despite a surge in the prominence of ESG investing, clients are all at different stages of their ESG journey, meaning there is no “one-size-fits-all” solution.
The S&P ESG index offerings enable users to access a broad and diversified index benchmark while removing:
- Business activities that may be deemed controversial;
- Violators of UNGC principles; and
- Companies that perform poorly relative to their industry group peers when considering E, S and G criteria.
The S&P 500 ESG Leaders Index sits between the less prohibitive exclusions of the S&P 500 ESG Index and the stricter exclusion criteria of the S&P 500 ESG Elite Index. Some may consider it Goldilocks’ choice of the S&P ESG index offerings—not too hot, not too cold, but just right.

Exclusions Follow a Rules-Based Methodology
The April 2022 rebalance resulted in roughly one-fifth (21%) of companies within the S&P 500 being excluded from the S&P 500 ESG Leaders Index. Of those excluded, 45% were removed due to having an ineligible S&P DJI ESG Score (see Exhibit 2). This is because the S&P 500 ESG Leaders Index removes the companies in the bottom 25% by S&P DJI ESG Score in the global GICS industry group. By implementing this screen, the index removes global ESG laggards when compared to their industry group peers.
Unlike the S&P 500 ESG Index, the S&P 500 ESG Leaders Index includes screens for shale energy and nuclear power. Of the exclusions, 8% were due to these screens, resulting in companies such as ConocoPhillips, Marathon Oil, Occidental Petroleum and NextEra Energy all being removed.
Gambling is another screen within the index, resulting in the removal of three companies: MGM resorts International, Las Vegas Sands and Caesars Entertainment.

Eligible ESG Credentials But Not Selected
The S&P 500 ESG Leaders Index targets the top 50% of companies by S&P DJI ESG Score in decreasing order within each GICS industry group. This results in several companies being eligible for inclusion, but not selected. For example, Warner Brothers, J.M. Smucker and American Airlines are all eligible for selection and are included in the S&P 500 ESG Index, which targets the top 75% of companies by S&P DJI ESG Score. However, they do not hit the 50% threshold needed for inclusion within the S&P 500 ESG Leaders Index.

Similar Historical Performance with a Stronger Carbon Profile
Despite having stricter exclusions than the S&P 500 ESG and more lenient thresholds than the S&P 500 ESG Elite Index, the S&P 500 ESG Leaders index still offers a diversified and broad sector allocation with strong ESG credentials. The index also offers a lower carbon footprint, lower weighted average carbon intensity and lower exposure to fossil fuels than the S&P 500 (see Exhibit 4).

Conclusion
When it comes to ESG indices, there is no one-size-fits-all solution—what is right for one investor does not necessarily fit the needs of another. As investor attitudes toward ESG investing continue to differ, it remains essential for market participants to understand their ESG conviction to choose a solution that enables them to reflect their beliefs in their investment needs. The S&P 500 ESG Leaders Index has been designed for those who seek the broad and diversified exposure typically offered by the S&P 500, while also taking a harder stance when it comes to excluding unsustainable business activities.
The posts on this blog are opinions, not advice. Please read our Disclaimers.