Get Indexology® Blog updates via email.

In This List

Not Your Father's Tech Sector

The S&P Global REIT QVM Multi-Factor Index Part I – Strategy Construction Process

Explore the Fast-Growing S&P Composite 1500 Internet & Direct Marketing Retail Index

Even Smarter Beta in South Africa? – Diversifying and Optimizing

Exploring New Tools for ESG Implementation in Australia

Not Your Father's Tech Sector

Contributor Image
Anu Ganti

U.S. Head of Index Investment Strategy

S&P Dow Jones Indices

As of the end of August 2020, the S&P 500® Information Technology sector had risen a remarkable 36% YTD. Such outstanding relative performance of course reminds us of the late 1990s, when the markets experienced a technology bubble and subsequent bust.

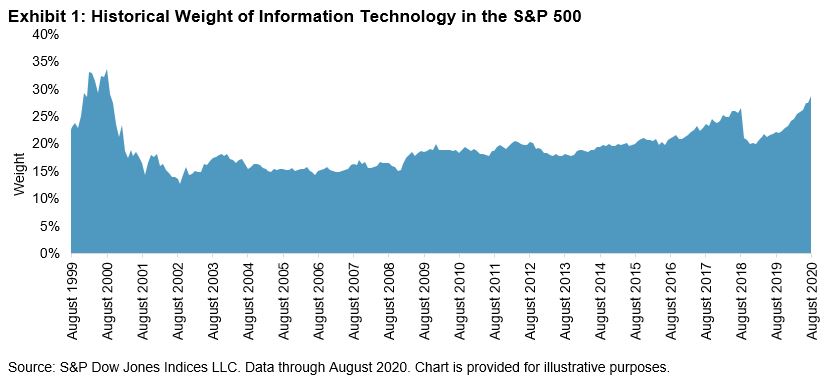
One notable resemblance to the late 1990s is Information Technology’s weight in the S&P 500. Information Technology makes up 28.7% of the S&P 500 today, and its weight hasn’t been this high since August 2000, when IT was 33.6% of the index, as we see in Exhibit 1.

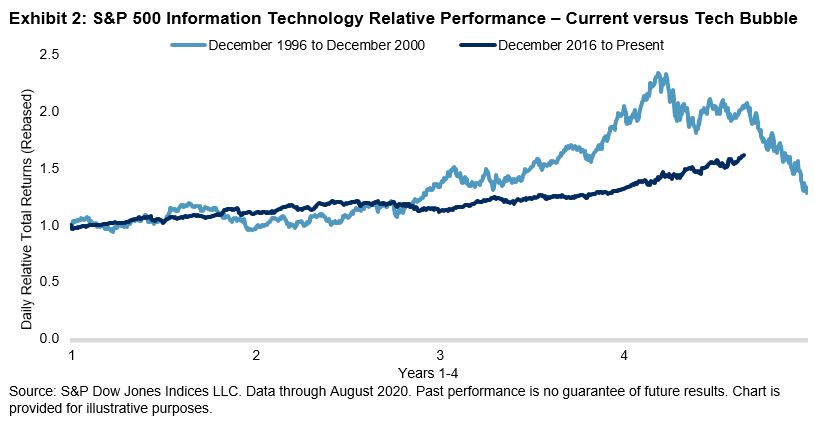
But the similarities end there. When we compare the most recent run-up in IT to its counterpart from 20 years ago, we observe that the current relative outperformance of the sector is much less extreme than during the late 1990s (see Exhibit 2). Moreover, the relative volatility of the IT sector was much higher then (December 1996-December 2000) than it is now, with an annualized standard deviation of daily relative returns of 23%—almost two and a half times the current period’s standard deviation of 9.5% (December 2016-August 2020).

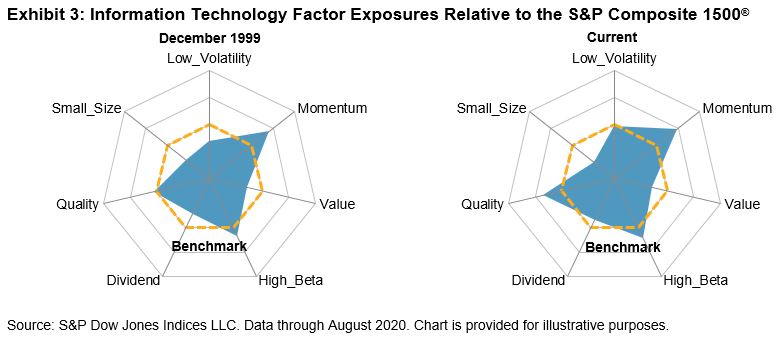
Finally, we observe significant differences when we compare the current factor exposures of the IT sector to its exposures in December 1999. Exhibit 3 shows that in 1999 and the present, IT had a strong tilt toward momentum and high beta and a tilt away from value. However, one of the main differences between now and then is that IT currently has much stronger tilts toward quality and low volatility than it did in 1999. This suggests that the companies within the current IT sector are both more profitable and less volatile now than they were 20 years ago.

Of course, with the considerable benefit of hindsight, we know that IT’s earlier outperformance peaked in March 2000. No one can know in advance what the future relative returns of the IT sector will be and whether its outperformance will continue, but history tells us that the Tech sector of today is not your father’s Tech sector.

The posts on this blog are opinions, not advice. Please read our Disclaimers.

The S&P Global REIT QVM Multi-Factor Index Part I – Strategy Construction Process

Contributor Image
Wenli Bill Hao

Director, Factors and Dividends Indices, Product Management and Development

S&P Dow Jones Indices

In this blog (and in a subsequent post), we will introduce the S&P Global REIT Quality, Value & Momentum (QVM) Multi-Factor Index. This index integrates individual quality, value, and momentum factor scores into one composite and is designed to capture multi-factor equity premia. In essence, the strategy seeks to include companies with the following characteristics: solid financial strength combined with steady fund flow from operation (FFO) growth, attractive valuation, and lasting risk-adjusted momentum.

The S&P Global REIT QVM Multi-Factor Index is a rules-based, transparent index solution. In the following sections, we present the framework and strategy construction process.

Establishing the Multi-Factor Framework

We use a systematic, bottom-up approach for stock selection and portfolio construction, as illustrated in Exhibit 1.

We start with the investment universe. Then we identify and select sensible factors for multi-factor metrics to capture the investment strategy. Furthermore, we select constituents with well-defined rules and construct a constituent portfolio with a predefined weighting methodology.

For our S&P Global REIT QVM Multi-Factor Index, we use the S&P Global REIT Index as the investment universe and an integrated approach to select constituents. The strategy is to invest in all-around winners in quality, value, and risk-adjusted momentum metrics. Exhibit 2 shows the factors and factor components for the QVM multi-factor strategy.

In the REIT industry, properties are depreciated for accounting purposes, which contrasts to the reality that property values generally increase over time. To better capture the unique character of the REIT industry, we use FFO per share rather than simple or derived earnings per share.

We use financial leverage ratio[i] and FFO growth variability[ii] metrics to capture a firm’s quality. In order to maintain sustainable and steady FFO growth, a firm shouldn’t build on excessive leverage. Moreover, we use the FFO to price ratio[iii] to gauge a firm’s reasonable valuation. In addition, we use 12-month risk-adjusted price momentum[iv] to select recent performance winners. With these metrics, we implement a hypothetical QVM multi-factor strategy.

Factor Z-Score and Multi-Factor Z-Score Calculation

The factor score calculation is an integral step of any multi-factor strategy. We calculate the quality, value, and momentum z-scores for each of the stocks in the eligible universe.[v] A integrated QVM multi-factor z-score is calculated for each constituent by taking the average of the quality, value, and momentum z-scores. Exhibit 3 shows their relationships. The benefit of multi-factor investing is more consistent performance due to diversified factor exposure.

Constituent Selection and Weighting

With integrated factor scores in place, we utilize an integration approach to construct multi-factor portfolios. The stocks are selected based on their combined QVM scores. For U.S. and non-U.S. companies, we select the top-ranked 20% stocks within each region. The target count of the U.S. group is set to 60% of the total index, and the non-U.S. group is set to 40%. Constituents are equal-weighted, with the resulting weights in U.S. and non-U.S. markets approximate to the relative market size of the benchmark for each group. In addition, a 20% buffer rule is applied to reduce portfolio turnover.v

In this blog, we discussed our QVM multi-factor strategy construction process. In our next blog, we will present the empirical results of the strategy’s performance, its country composition, and its factor exposure.

[i] The financial leverage ratio is calculated as a company’s latest total debt divided by its book value per share (BVPS) for each security in the index universe as of the rebalancing reference date.

Financial Leverage Ratio = Total Debt / (BVPS * Common Shares Outstanding)

[ii] FFO growth variability is calculated as the standard deviation of year-over-year FFO growth per share over the past five fiscal years. If five-year data is not available, then we use four-year data. If four-year data is not available, we use three-year data. A minimum of the last three comparable GGO growth values are needed to compute FFO growth variability.

Where

FFOgi = (FFOi-FFOi-1)/ FFOi-1

FFOgm = mean (FFOgi)

n = number of years of growth

[iii] FFO to price ratio (FFO2P) is calculated as a company’s trailing 12-month funds flow from operation per share divided by its price.

[iv] 12-month risk-adjusted price momentum is computed as the 12-month price change, excluding the most recent month of the security in local currency. If 12 months of price history is not available, the momentum value is calculated from nine months of price history. For more information on momentum calculation, please refer to the S&P Momentum Indices methodology.

[v] Please refer to the S&P Global REIT QVM Multi-Factor Index methodology for more details.

The posts on this blog are opinions, not advice. Please read our Disclaimers.

Explore the Fast-Growing S&P Composite 1500 Internet & Direct Marketing Retail Index

Contributor Image
Rachel Du

Senior Analyst, Global Research & Design

S&P Dow Jones Indices

Technological advancements and resulting social transformations have changed our daily lives. Traditional retailers have increased their usage of business channels such as the internet, mail order, and TV home shopping to attract their customers. The trend of this business transition has been reflected in the stock market.

Among all the 68 industry indices in the S&P Composite 1500® as of July 31, 2020, the Internet & Direct Marketing Retail industry stood out with its rapid growth of market share. The S&P Composite 1500 Internet & Direct Marketing Retail Index includes companies providing retail services primarily on the internet and through mail order and TV home shopping retailers, as well as companies providing online marketplaces for consumer products and services. Within the S&P Composite 1500, the weight of the S&P Composite 1500 Internet & Direct Marketing Retail Index grew from 0.06% at the end of 1994 to 5.00% as of July 31, 2020.

The market value of the industry has also increased significantly, particularly in recent years. Exhibit 1 shows that the industry has expanded over the past 15 years. The float market capitalization of the S&P Composite 1500 Internet & Direct Marketing Retail Index grew more than 600 times its original size at the end of 1994. Meanwhile, the rest of the industries in the S&P Composite 1500 had an average sixfold increase in terms of float market capitalization. As of July 31, 2020, the industry had USD 1,468 billion in float market capitalization, with Amazon.com Inc., Booking Holdings Inc., and eBay Inc. being its largest companies.

The S&P Composite 1500 Internet & Direct Marketing Retail Index delivered significant outperformance over the short- and long-term investment horizons (see Exhibit 2). During the past 5- and 10-year periods, the industry index provided risk-adjusted returns of 1.33 and 1.41, respectively, compared with the 0.72 and 1.0 generated by the S&P Composite 1500 during the same respective periods.

During market downturns, the industry demonstrated its strong resilience and ability to quickly recover. Exhibit 3 shows how the S&P Composite 1500 Internet & Direct Marketing Retail Index performed when experiencing the three worst market pullbacks, as measured by the S&P Composite 1500. The industry produced large margins of excess returns during the down markets and rebounded with powerful returns. The YTD return of the index as of July 31, 2020 was 61.27%, compared with 1.24% for the overall market.

The evolution of technology has encouraged the growth of online business. This trend is visible in the growth of the S&P Composite 1500 Internet & Direct Marketing Retail Index. Understanding the transformed economic reality can help identify potential investment opportunities.

The posts on this blog are opinions, not advice. Please read our Disclaimers.

Even Smarter Beta in South Africa? – Diversifying and Optimizing

Contributor Image
Andrew Innes

Head of Global Research & Design

S&P Dow Jones Indices

The equity risk premia from factors (such as quality, momentum, and low volatility) have been widely accepted and adopted by investment practitioners across the globe and South Africa alike. The belief by many is that exposure to these risk factors, in addition to the market, could reward investors over the long term.

While the long-term outperformance of most factors can be backed by economic rationale, each is still susceptible to significant drawdowns over short-term horizons. Timing factor exposures is one option to avoid this; however, it may require a crystal ball to navigate the markets. Better yet, diversifying across multiple factors at once could offer a more attractive solution. Since factor returns are relatively uncorrelated, the benefits of diversification may generate more stable excess return outcomes.

The new S&P South Africa Quality, Momentum & Low Volatility (QML) Optimized Multi-Factor Index adopts this philosophy and aims to systematically capture multiple risk premia simultaneously through an optimization approach. Exhibits 1 and 2 show the back-tested results of this strategy, which has been effective to date.

The primary objective of the multi-factor index seems simple enough; select stocks with the best quality, value, or momentum exposure. However, practically implementing this selection while adhering to other portfolio concerns can be fraught with challenges. For instance, how does one ensure that:

  • The intended factor exposures are well balanced;
  • The unintended sector exposures are limited;
  • The tracking error to the benchmark index is controlled; and
  • The turnover is low, efficient, and liquid to minimize trading costs and ensure capacity?

Optimizing the portfolio selection process is arguably the simplest way to solve this complex predicament. Through the power of a portfolio optimizer, its accompanying risk model, and S&P DJI’s Factor Scores, the solution reveals itself.

A mathematical optimization process is employed to help discover the most suitable stock selection and weighting that meet the objective to maximize multi-factor exposure, while abiding by any portfolio constraints. The constraints are simply a set of rules that help define the characteristics of the index.

In the case of the S&P South Africa QML Optimized Multi-Factor Index, these constraints include the following:

  • Balanced active factor exposures to quality, momentum, and low volatility;
  • Sector weights between 50%-150% of its benchmark weights;
  • Predicted tracking error to the benchmark index targeting 4%;
  • Quarterly two-way turnover of no more than 25%; and
  • The turnover of any position (i.e., each trade) should reflect the available liquidity.

In summary, the S&P South Africa QML Optimized Multi-Factor Index has historically achieved systematic diversification across factors through the powerful precision of its optimization process. Its controlled tracking error to the benchmark may also make it attractive to market participants looking for a core holding. Equally, those typically enticed by active funds’ promise of potentially higher returns could be compelled by the index’s historical performance, not to mention the relative advantages of lower cost and greater transparency associated with passive products. Either way, the S&P South Africa QML Optimized Multi-Factor Index may represent the next generation of smart beta for South Africa.

The posts on this blog are opinions, not advice. Please read our Disclaimers.

Exploring New Tools for ESG Implementation in Australia

As modern ESG strategies built on core indices like the S&P/ASX 200 ESG Index arrive, advisors and asset managers are increasingly asking – How does ESG work in purpose-built portfolios? S&P DJI’s Stuart Magrath joins SSGA’s Meaghan Victor to discuss what ESG implementation looks like in practice.

Learn more: www.spglobal.com/spdji/since-2000


The posts on this blog are opinions, not advice. Please read our Disclaimers.