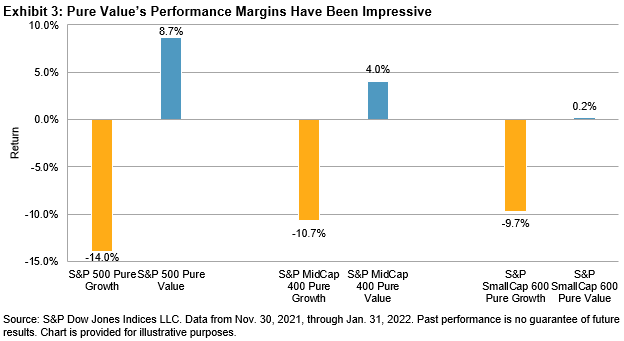
It has been a tricky start to 2022, with drawdowns in many segments of the equity markets. Stocks have experienced divergent performances amid varied earnings announcements, a surging energy complex, geopolitical risks, and expectations for interest rate hikes from the U.S. Federal Reserve. Though far from the same magnitude, recent returns have been reminiscent of March 2020. Indeed, the 29% monthly difference between the best- and worst-performing S&P 500® sectors in January 2022 was the highest since March 2020. Some market participants may be contemplating portfolio changes in response to recent drawdowns, but others may wish to consider the potential power of doing nothing.
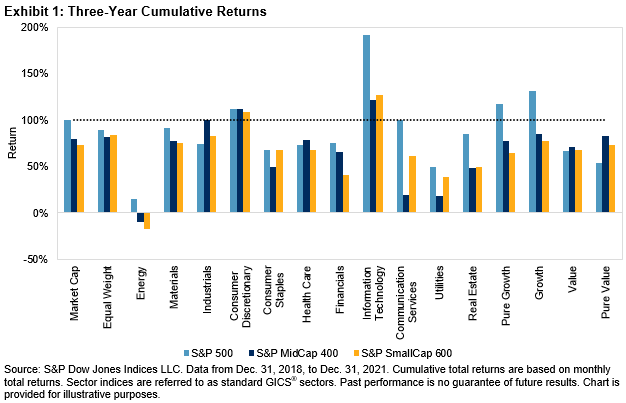
Exhibit 1 shows that the performance of the S&P 500, S&P MidCap 400®, and S&P SmallCap 600®, as well as their equal-weight, sector, and style variations, was resoundingly positive over the three-year period ending Dec. 31, 2021. Although the past three years offered their fair share of sentiment-shifting trends, from the market plunge due to onset of the COVID-19 pandemic, turbulence around the 2020 U.S. presidential election, and the closely watched response from the U.S. Federal Reserve to rising inflation, the S&P 500 posted a whopping 100% total return. Information Technology led the way with a 190% total return, and all but two indices finished with positive returns.
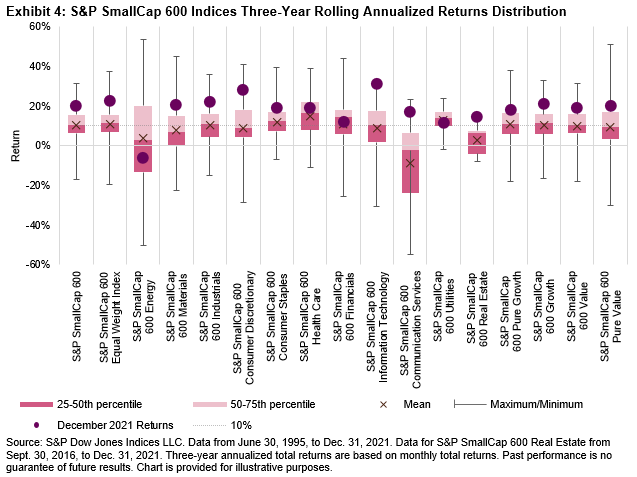
Exhibits 2-4 offer greater context by showing the distributions of three-year rolling annualized returns since June 1995 (Real Estate data goes back to 2016, when it became a standalone GICS sector). The charts show the interquartile range, mean, and median three-year rolling total returns for each index. The whiskers extend to the maximum and minimum values, and the latest returns are annotated as dots. Across the size spectrum, recent returns for most indices were higher than their respective 75th percentiles, with particularly strong returns—by historical standards—coming from a number of S&P 500-based indices.
For example, Exhibit 2 shows that recent three-year returns for the S&P 500 and most of its related indices were well above their long-term averages, except for the Energy, Utilities, and Pure Value indices. By percentile ranking, the S&P 500 (95%), S&P 500 Equal Weight (97%), S&P 500 Materials (99%), S&P 500 Real Estate (100%), and S&P 500 Growth (96%) are all ranked above 95% percentile in their respective history.
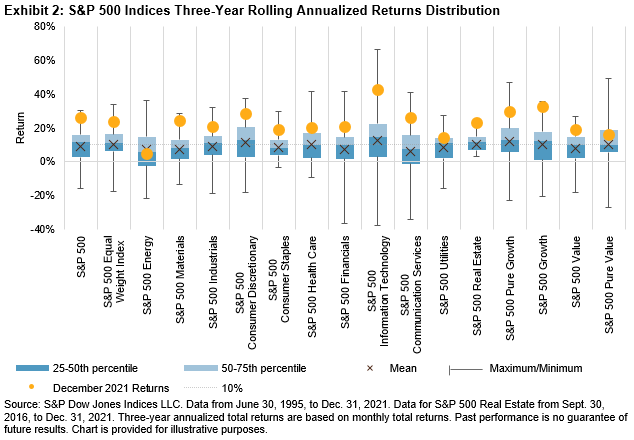
Exhibit 3 shows that the recent three-year performance for the S&P MidCap 400 and its related indices were also typically above their historical averages. The S&P MidCap 400 Industrials and Consumer Discretionary sectors posted particularly prominent returns relative to their respective historical returns, ranking in their 98% and 99% percentiles, respectively.
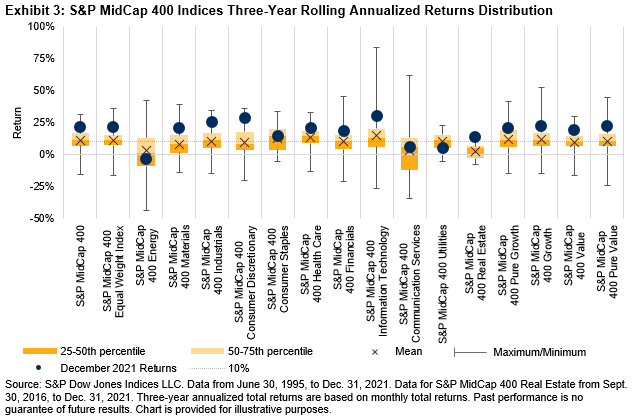
Exhibit 4 tells a similar story for the S&P SmallCap 600 Indices. All but three indices posted above average three-year rolling total returns, with the Information Technology sector’s returns within touching distance of its maximum.
The strong performance across the U.S. equity capitalization spectrum in recent years demonstrates the potential power of tracking the U.S. equities market. Given the challenges of successfully timing the market, some may wish to remember that time in the market could be more important than timing the market.
The posts on this blog are opinions, not advice. Please read our Disclaimers.