Get Indexology® Blog updates via email.

In This List

Sparks Are Flying in the Energy Complex

Breaking the Market Cap Weight with an Index

S&P Risk Parity 2.0 Index Methodology Highlights

The S&P GSCI Was Energized in September

Why Benchmarks Matter

Sparks Are Flying in the Energy Complex

Contributor Image
Fiona Boal

Managing Director, Global Head of Equities

S&P Dow Jones Indices

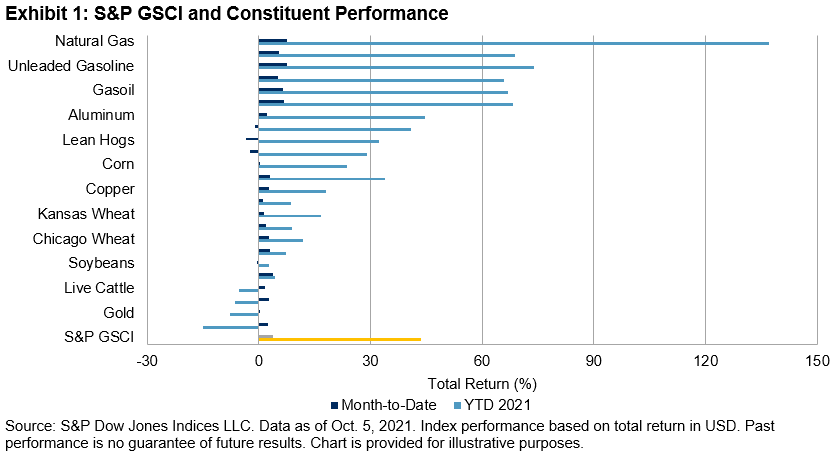
The broad-based S&P GSCI started Q4 2021 off with a bang; as of October 5 it was up 3.9% for the month and 44% YTD. The spot version of the index has reached its highest level since October 2014. Natural gas and the petroleum complex have continued their dominance of the commodity charts, filling out the top six spots among S&P GSCI constituent performances for the month. However, they all pale in comparison to U.K. and European natural gas prices, which currently sit outside the S&P GSCI single commodity series. The S&P GSCI Natural Gas, which seeks to track the performance of U.S. natural gas prices, was up 137% YTD, while benchmark U.K. natural gas prices have more than quadrupled since the beginning of June, and Dutch gas prices have risen nine-fold since the beginning of the year.

Record natural gas and electricity prices in Europe, record coal prices in China, multi-year highs in natural gas prices in the U.S., and Brent crude prices tipping USD 82/barrel are all manifestations of a global energy shortage that has come into sharp focus over recent weeks. Supply chains are stretched, in some cases broken, and energy stockpiles are abnormally low. Unusual weather has worsened the energy supply crunch, while ambitious climate plans and a growing reliance on renewable energy sources have further complicated the situation. However, energy crises are not a new phenomenon. The challenge this time around is that the global economy is recovering more quickly than expected from a once-in-a-generation economic shock while most countries are simultaneously ramping up their commitment to the energy transition and a net-zero carbon future.

Arguably, the market is doing its job; prices and volatility have spiked in an attempt to destroy sufficient demand to protect depleted inventories. European gas and electricity prices are now signaling the need for urgent factory closures in order to reduce gas consumption. For manufacturers, shutdowns have the effect of cutting energy costs, but they can also drive up the price of their products, which in turn may see inflation worries bleed from energy to other sectors of the economy.

European importers have been locked in competition with Asian buyers to attract extra liquefied natural gas cargoes, while pipeline deliveries from Russia have so far failed to respond to higher prices. China is facing an electricity squeeze of its own from a shortage of coal supplies, tougher carbon emissions standards, and strong post-pandemic demand from manufacturers and heavy industry, which have triggered widespread curbs on usage.

Physical commodities markets are prone to exaggerated price moves in both directions, and the high prices and associated levels of extreme volatility across the energy complex reflect an acute shortage of the raw materials needed to produce the energy that powers every aspect of the global economy. How long the situation takes to revert, or at least stabilize, remains to be seen, but this is yet another example of the importance of appreciating the role of commodities in the broad financial ecosystem, even for those market participants who have no intention of trading European natural gas.

The posts on this blog are opinions, not advice. Please read our Disclaimers.

Breaking the Market Cap Weight with an Index

Contributor Image
Meb Faber

Chief Investment Officer

Cambria Investment Management

When people talk about indexes, they are usually referring to market-cap weighted indexes.

Market-cap weighting is based on price and outstanding number of shares. One simply takes the number of shares outstanding and multiplies them by the share price to arrive at market cap. This calculation results in the biggest companies commanding the largest weights.

The first goal of the S&P Global QVM Multi-Factor Index is to “break the market-cap link” that many indices utilize.

Instead of weighting by market capitalization, the index – and a fund based on the index — holds all companies with a nearly equal weighting. This accomplishes a few objectives.

First, it provides broader diversification across the REIT sector by avoiding the index constituents being concentrated in only a handful of names. Second, it favors smaller companies relative to market-cap weighted indexes by giving them the same weighting in the index as large-cap firms. Lastly, the index also may tilt towards value.

So, what’s the real benefit of these steps as manifested in risk-adjusted returns?

To answer that, below we compare three approaches to the REIT sector. First, we’ll examine market cap weighted U.S. REITs; second, we’ll expand to include market cap weighted global REITs; and third, we’ll look at global REITs with the aforementioned factors – in other words, S&P Global REIT Quality, Value & Momentum (QVM) Multi-Factor Index.

As you’ll see, for similar volatility levels using back-tested data with respect to the periods listed below, the S&P Global REIT Quality, Value & Momentum (QVM) Multi-Factor Index experienced a few percentage points of additional performance over U.S. and global REITs, with similar or lower levels of volatility and drawdowns.  Index performance does not equal fund performance because one cannot invest directly in an index, and index performance does not reflect management fees, trading costs and other expenses.

How REITs Can Affect a Broader Investment Portfolio

Does a REIT allocation add any benefit to a traditional equity/fixed income portfolio?

Below is a sample hypothetical 60/40 portfolio composed of U.S. stocks as represented by the S&P 500 and U.S. 10-year government bonds, back-tested with monthly rebalances.  In the second column, a hypothetical allocation of 20% of REITS as represented by the constituents of the S&P Global REIT Quality, Value & Momentum (QVM) Multi-Factor Index has been introduced.

The historical back-tested data results for this time period show an increase of over 1.3% in annual performance. The REIT allocation does increase volatility slightly, but the end result is a higher portfolio Sharpe Ratio.

To learn more about the S&P Global REIT Quality, Value & Momentum (QVM) Multi-Factor Index, it’s described in greater detail in Part I and Part II. See also the methodology.

Disclaimer:

The views and opinions of any third-party author are his/her own and may not necessarily represent the views or opinions of S&P Dow Jones Indices or any of its affiliates.

The posts on this blog are opinions, not advice. Please read our Disclaimers.

S&P Risk Parity 2.0 Index Methodology Highlights

Contributor Image
Berlinda Liu

Former Director, Multi-Asset Indices

S&P Dow Jones Indices

This blog is the second in a three-part series introducing the S&P Risk Parity 2.0 Indices. The first blog highlighted the differences between these new indices and the original ones. In this installment, we will take a closer look at the methodology of the newly launched S&P Risk Parity 2.0 Index Series.

Constituent Changes

Incorporating TIPS

Although commodity prices tend to increase in value with rising inflation, many investors prefer to have a more explicit inflation hedge. Treasury inflation-protected securities (TIPS) are designed to increase in value to keep pace with inflation. Their principal is tied to inflation and interest is paid based on the adjusted principal.

In this index series, the S&P U.S. TIPS 7-10 Year Index was selected to represent TIPS. U.S. TIPS are typically liquid, especially across the 7-10-year maturities, which are of similar tenors to several of the other fixed income constituents included in the index.

TIPS as a Fourth Asset Class

When including TIPS in the index, thought had to be given as to how to position them—namely whether they should be bucketed with another asset class or stand alone. TIPS are not expected to react in similar ways to changes in growth and inflation as the other three asset classes (equities, nominal bonds, and commodities). But there were several other considerations when deciding whether to bucket with another asset class (i.e., comparison of volatilities, weighting approach, and impact on overall risk/return characteristics and leverage).

Overall, given the unique characteristics of TIPS, it was deemed most appropriate to include them as a separate asset class. Therefore, the S&P Risk Parity 2.0 Indices include four asset classes: equities, nominal bonds, commodities, and TIPS.

Allocation Changes

Marginal Contribution to Risk

Now that the S&P Risk Parity 2.0 Indices include TIPS, which have a 60-70% correlation with nominal bonds, Marginal Contribution to Risk (MCTR) is deemed a more comprehensive risk measure. It accounts for both correlation and volatility to assess the risk of each asset class in terms of its contribution to the overall portfolio.

Budgeted Risk Allocation

As part of the index design process, different risk budgets (such as 10%, 15%, 20%) were evaluated for TIPS. This analysis, as well as input from several market participants, led to the decision to allocate 15% risk to TIPS, with the remaining 85% risk split equally among equities, nominal bonds, and commodities.

Limiting TIPS to 15% was deemed most appropriate since it reduced the combined exposure to bonds (nominal and inflation-linked) as well as the overall leverage while still providing sufficient exposure to meaningfully contribute and to provide an inflation hedge.

Equal Notional Weights within Nominal Bonds

Within the nominal bonds asset class bucket, 10-year JGB futures have the lowest volatility and correlation to other bond futures. If the risk is allocated equally across the constituents, roughly one-third of the asset class weight is allocated to JGB. Furthermore, it leads to a substantial increase to the asset class weight and to the overall leverage. To prevent this, the constituents in the nominal bond asset class bucket are equally weighted.

In the next blog, we will discuss the performance of these newly launched indices.

The posts on this blog are opinions, not advice. Please read our Disclaimers.

The S&P GSCI Was Energized in September

Contributor Image
Jim Wiederhold

Former Director, Commodities and Real Assets

S&P Dow Jones Indices

The S&P GSCI, the broad commodities benchmark, rose in September by 6.0%. Energy-related commodities were the outperformers on the back of what may prove to be a lasting global energy supply crunch. Agriculture and metals were mostly lower over the month.

Record natural gas and electricity prices in Europe, record coal prices in China, multi-year high natural gas prices in the U.S., and oil prices tipping USD 80 per barrel are all manifestations of a global energy shortage that came into sharp focus in September. The S&P GSCI Natural Gas rallied 32.9%, while the S&P GSCI Petroleum jumped 10.0% over the month. While OPEC+ has started gradually restoring the output that was shuttered at the height of the COVID-19 pandemic, the inability of some members to raise output to agreed levels due to underinvestment and maintenance is increasing the burden on top producers such as Saudi Arabia to meet strong post-pandemic demand.

Most commodities within the agriculture space moved lower in September, cooling off after strong YTD performance. The USDA’s Quarterly Grain Stocks Report confirmed that U.S. corn and soybean stocks were larger than expected, while U.S. wheat stocks were at a 14-year low. The S&P GSCI Soybeans dropped 2.8% over the month. The S&P GSCI Cotton was one of the few outperformers in the agriculture complex, moving higher by 14.4% due to the same weather-related issues faced by the energy sector. Much of the cotton-growing regions in the U.S. were in the path of Hurricane Ida earlier in the month.

The S&P GSCI Livestock fell 3.0% in September, with live and feeder cattle prices taking a hit on the supply side from high slaughter rates, and on the demand side from concerns over the longevity of beef export demand and the possible impact of inflation on U.S. consumers’ consumption patterns.

Industrial metals were a mixed bag, with most falling in September, but the S&P GSCI Aluminum moved higher by 5.0% and was up 41.4% YTD. Concerns regarding the availability of bauxite, the raw material used to produce aluminum, combined with power outages and a government crackdown on polluting industries in China, have greatly disrupted the aluminum supply chain.

The S&P GSCI Precious Metals fell 3.7%, as the U.S. dollar reached a new one-year high. As U.S. yields jumped higher, assets that provide no yield like gold or silver took the hit. Historically expected to provide a strong hedge to inflation, gold’s inflation beta has declined rapidly over the past two years, while other commodities like crude oil have shown a much stronger relationship to moves in inflation.

The posts on this blog are opinions, not advice. Please read our Disclaimers.

Why Benchmarks Matter

Contributor Image
Craig Lazzara

Former Managing Director, Index Investment Strategy

S&P Dow Jones Indices

I recently had the pleasure of participating in a webinar on the basics of passive management. A portfolio manager in the audience posed an important question which I’ll paraphrase: “If my goal is to earn a return of X%, why is an index’s performance relevant?” Otherwise said, if I want to earn a particular absolute return, why should I care about returns relative to an index?

This is a good question, and the answer, like the answer to many good questions, is that “it depends.” What it depends on is the answer to a subsidiary question: if an investor’s goal is to earn a return of X%, by what means does he intend to pursue that goal?

There are many asset classes out there: one might buy gold bars, or bitcoins, or Old Master paintings. But for the most part, investors and fiduciaries pursue their absolute return goals by investing in securities. And in securities markets, index returns are relevant for at least two reasons.

First, properly constructed benchmarks define the investor’s opportunity set. Capitalization-weighted indices like the S&P 500® are designed, in part, to track the value of a stock market; changes in the aggregate value of the stock market are reflected directly in the returns of the index. If the investor’s goal is to earn 8% annually, and the market in which he’s invested declines by 20% this year, he’s almost certainly not going to make it. And if the market index rises by 20%, he’s almost certainly not going to be satisfied with 8%. Absolute return is an aspiration; relative return is actionable.

Second, the returns of a portfolio relative to a market index are evidence of a manager’s skill. Clients have choices: they can own a market passively or attempt to outperform it actively. If the measure of success for an active manager is to outperform a benchmark appropriate to his investment style, the evidence is clear that most active managers fail most of the time; indeed over long time horizons, the advantage of index management is enormous.

Investors who are willing to accept index returns, therefore, typically see better results than those who strive to outperform. A willingness to forgo relative returns may be the key to improving absolute performance.

The posts on this blog are opinions, not advice. Please read our Disclaimers.