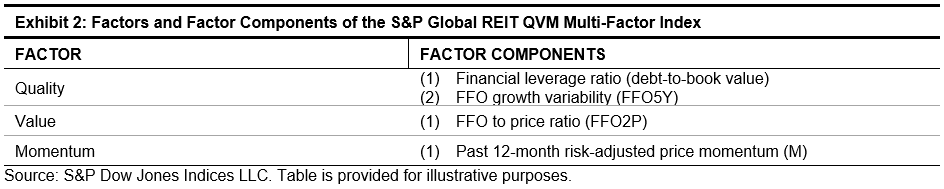
In the previous blog, we introduced the construction process of the S&P Global REIT Quality, Value & Momentum (QVM) Multi-Factor Index. In this blog, we look into the empirical results of the strategy.
Performance
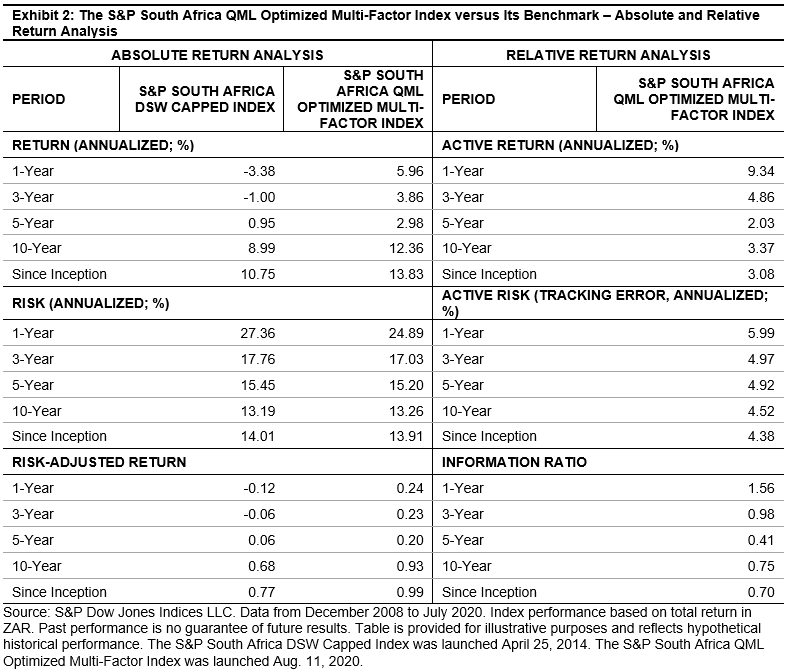
Rebasing the two indices to 100 on June 30, 1999, the S&P Global REIT QVM Multi-Factor Index reached 999.42 on Aug. 31, 2020, while the S&P Global REIT reached 585.23 (see Exhibit 1).
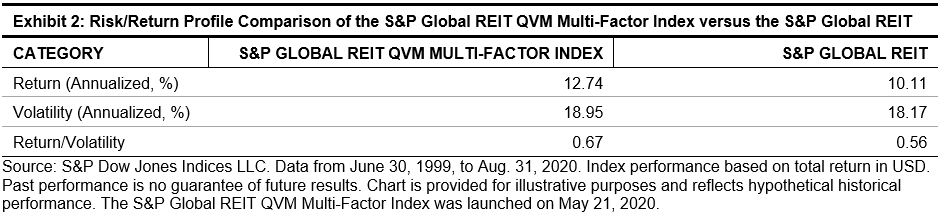
Exhibit 2 shows the average risk/return profile of the S&P Global REIT QVM Multi-Factor Index against the S&P Global REIT. The S&P Global REIT QVM Multi-Factor Index had a higher annualized average return (12.74%) than the S&P Global REIT (10.11%). On a risk-adjusted basis, the S&P Global REIT QVM Multi-Factor Index was also higher, at 0.67, than the S&P Global REIT, at 0.56.
From both its cumulative performance and average risk/return profile, historically, the QVM strategy has delivered higher returns and risk-adjusted returns than the underlying benchmark (the S&P Global REIT) over a long-term investment horizon.
Country Composition
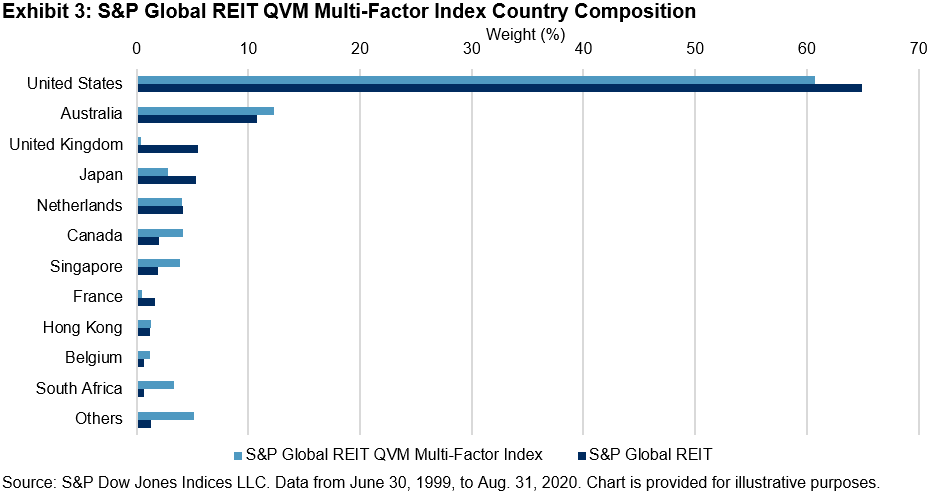
The S&P Global REIT QVM Multi-Factor Index uses a bottom-up stock selection approach for regional composition. The only constraint is that U.S. companies account for 60% of the weight, while non-U.S. companies account for 40%. As shown in Exhibit 3, the historical country weight composition was in line with the design, with U.S. companies weighted at about 60.7% over the period studied. In comparison with its benchmark, the index underweighted the U.S. (-4.2%), the UK (-5.1%), and Japan (-2.5%), while it overweighted countries such as Australia (+1.5%), Canada (+2.2%), Singapore (+1.9%), and South Africa (+2.7%).
Fundamental Risk Factor Exposure
To better understand the characteristics of the S&P Global REIT QVM Multi-Factor Index, we use a commercially available fundamental risk model to capture selected risk factor exposure differences (see Exhibit 4).
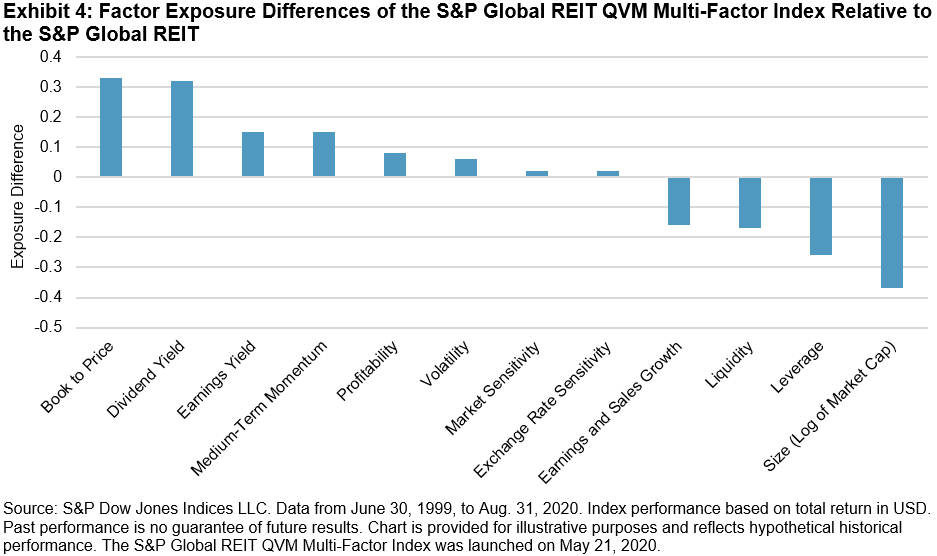
The strategy had the highest positive tilt toward book to price (0.33), followed by dividend yield (0.32), earnings yield (0.15), medium-term momentum (0.15), and profitability (0.08). Results show the strategy constituents tended to have higher value (correlated to the FFO to price ratio factor), higher momentum, and better profitability.
On the other hand, the index was most underweight in regard to size (-0.37), followed by leverage (-0.26), liquidity (-0.17), and earnings and sales growth (-0.16) factors. This means companies in the S&P Global REIT QVM Multi-Factor Index tended to be of a smaller size (due to equal weight), have lower leverage, be less liquid (related to smaller size and equal weight), and have more steady growth than companies in the S&P Global REIT.
These results showed that the strategy characteristics were in line with the index design to invest in companies featured with good quality, attractive valuation, and durable risk-adjusted momentum.
In conclusion, through a QVM multi-factor integration approach, the S&P Global REIT QVM Multi-Factor Index met its design objective and had superior returns and risk-adjusted returns to its benchmark, the S&P Global REIT, over the period studied.
The posts on this blog are opinions, not advice. Please read our Disclaimers.