Get Indexology® Blog updates via email.

In This List

Why Cap Weighting?

Risk-Adjusted SPIVA®: No More Excuses?

Building a Sustainable Core with the S&P 500 ESG Index

Is Canada Inadvertently Excluded from Your International Equity Allocation?

While Fixed Income Yields Remain Low, Theta Gang Generates Income through Covered Calls

Why Cap Weighting?

Contributor Image
Craig Lazzara

Former Managing Director, Index Investment Strategy

S&P Dow Jones Indices

Journalists and others occasionally offer comparisons of capitalization-weighted index funds with other weighting schemes. Some of these efforts are more useful than others, but none, in my experience, identify the question that cap-weighted indices were initially designed to answer, and which accounts for their enduring economic significance. That question is, simply put: What is the total value of the stock market?

If we want to compute the total value of any stock market, the procedure is simple: for each company in the market, multiply shares outstanding by price, and add up the individual results. We can make the calculation as often as we like (or as often as our computational powers permit). By comparing values at two different periods, we can derive the market’s return; dividing Tuesday’s market value by Monday’s market value tells us Tuesday’s return. This is mathematically equivalent to multiplying each individual stock’s return by its beginning weight. In other words, the percentage return of a capitalization-weighted index tells us the percentage change in the aggregate value of all the stocks in the index.

No other weighting scheme produces this result. The percentage return of an equally weighted index, for example, tells us the return of the average stock, but not the change in the value of the entire stock market. Factor and thematic indices likewise have many uses, but are not particularly useful in telling us anything about the value of the entire market. Capitalization-weighted indices thus have a unique importance for economists; the S&P 500®, for example, is a leading indicator of the performance of the U.S. economy.

None of this discussion has anything to do with index funds, and of course indices were used for economic analysis long before they became the basis for financial products. Serendipitously, several attributes of capitalization-weighted indices make them particularly useful as the basis for index funds. The most important of these is that cap-weighted index funds are relatively easy (and cheap) to maintain. Unless the underlying index changes, a properly constructed cap-weighted index fund is not required to trade. Changes in the value of index components are exactly reflected in the value of the fund. Other popular weighting schemes (e.g., equal weighting or factor weighting) inherently require more turnover.

In part because cap-weighted indices don’t require much trading, in part because they can represent an entire economy rather than simply one aspect of it, and in part because we can’t all be above average, cap-weighted indices also continue to be demonstrably hard to beat. The popularity of capitalization-weighted indices is not arbitrary or inexplicable. We live in a capitalization-weighted world, and cap-weighted indices are a reflection of that reality.

The posts on this blog are opinions, not advice. Please read our Disclaimers.

Risk-Adjusted SPIVA®: No More Excuses?

Contributor Image
Alberto Allegrucci

Former Senior Research Analyst, Global Research & Design

S&P Dow Jones Indices

For the first time, the SPIVA Europe Mid-Year 2020 Scorecard introduced risk-adjusted performance evaluations of European equity funds. Previously, proponents of active fund management may have criticized the SPIVA scorecard for measuring performance on a return-only basis. They may have argued that this only told one side of the story, and that their abilities should also have been judged on the level of risk that they employed. After all, given funds with similar returns, would investors not prefer the fund with lower risk? A similar question could arise when comparing active funds with their benchmarks. Do benchmarks perform better simply because they take on more risk? Adjusting returns by the risk involved allows us to tell the whole story and more closely compare how well active funds and their benchmarks performed per unit of risk taken.

Do European Benchmarks Still Perform Well on a Risk-Adjusted Basis?

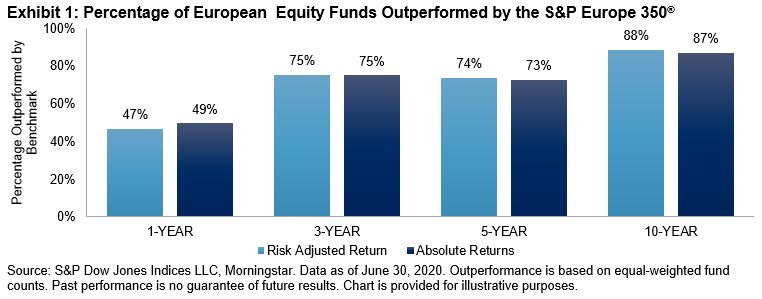
In our latest SPIVA Europe Scorecard, a fund or benchmark’s risk-adjusted return was computed as the annualized average monthly return divided by annualized standard deviation of the monthly return for the period observed. The intuition is straightforward: rather than looking at absolute returns, we looked at the returns attained per unit of risk borne by the investor. Exhibit 1 shows the percentage of European equity funds outperformed by their benchmark and compares the metrics computed using different measures of performance. The percentage of funds that outperformed the benchmark was largely unaffected by adjusting the performance by its risk, and the notion that active funds may yield lower returns because they were less risky did not seem to be confirmed by the data. Otherwise, once adjusted for risk, we should have seen a much lower percentage of active funds being outperformed by their benchmark across the different time periods. Instead, we saw similar numbers, which increased steadily when looking at the medium to long term. This highlights a stylized fact already well substantiated by our SPIVA scorecards: in the long run, the majority of active funds failed to beat the benchmark.

The U.K. Case

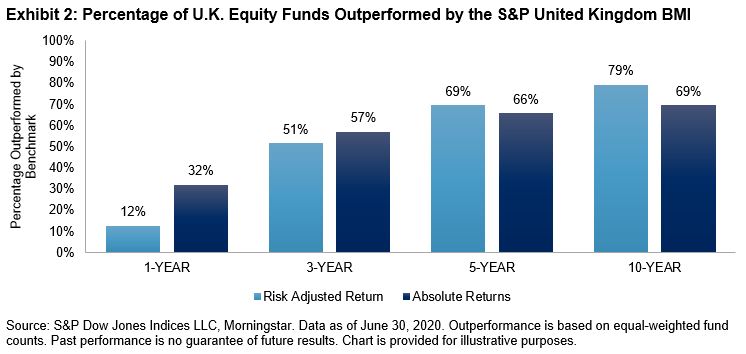
Exhibit 2 shows the results of carrying out the same exercise for U.K.-focused equity funds. In the short term, active funds performed better on a risk-adjusted basis: only 12% were outperformed by the benchmark on a risk-adjusted basis, compared with 32% when looking at absolute returns. However, when looking at longer periods, the same pattern as was seen in Europe emerged. Not only did it seem harder for active funds to beat their benchmark in absolute performance terms, but their risk-adjusted performance could not keep up either. Across the 10-year period, the relationship seen in the short term was inverted; on a risk-adjusted basis, a larger percentage of active funds were outperformed by the benchmark compared to an absolute return basis.

Our SPIVA Europe Mid-Year 2020 Scorecard also shows risk-adjusted performance metrics for other European fund categories. In most cases, the conclusion was similar: risk adjustment did not seem to save active funds from being outperformed by their benchmarks. With this new addition to the SPIVA Europe Scorecard, it begs the question, “Are there any more excuses left for active managers?”

The posts on this blog are opinions, not advice. Please read our Disclaimers.

Building a Sustainable Core with the S&P 500 ESG Index

As demand for ESG continues to grow, how is the S&P 500 ESG Index helping investors reinforce core allocations and align objectives with ESG values? S&P DJI’s Maggie Dorn and State Street Global Advisors’ Brie Williams take a closer look at the potential benefits of putting this index to work in purpose-built portfolios.

Learn more: https://www.spglobal.com/spdji/en/education/article/the-sp-500-esg-index-defining-the-sustainable-core/


The posts on this blog are opinions, not advice. Please read our Disclaimers.

Is Canada Inadvertently Excluded from Your International Equity Allocation?

Contributor Image
Michael Orzano

Head of Global Exchanges Product Management

S&P Dow Jones Indices

For a U.S. investor, developed market exposure outside of the U.S. is a core building block in forming a comprehensive global portfolio. In part because of its status as the world’s first international equity index, MSCI EAFE enjoys a commanding market presence for international equity benchmarks. It also serves as the underlying index for many of the largest international equity ETFs and index funds. However, what many don’t realize is that MSCI EAFE excludes Canadian securities entirely, which may create an unintended gap in exposure or reflect an unfair performance benchmark for a manager focused on developed ex-U.S. equities.

In our third blog in a series highlighting key features of the global equity benchmark landscape, we explore the limitations of choosing MSCI EAFE as a regional representation of the international equities asset class.

Exhibit 1 depicts the country composition of MSCI EAFE compared to the S&P Developed ex-U.S. BMI, which includes all developed markets excluding the U.S. With an 8.4% weight, Canada was the third largest market out of the 24 countries included in the S&P Developed ex-US BMI as of Sept. 30, 2020.

Without a separate, standalone allocation to Canada, a global equity portfolio based on the S&P 500®, MSCI EAFE, and an emerging markets equity index would exclude Canada, the world’s fifth largest equity market, entirely.

When evaluating international equity index exposures, it is critical to fully understand the underlying benchmark being tracked to ensure it is covering all countries you expect it to include. Similarly, an actively managed fund should not be benchmarked to an index that excludes Canada if its mandate is to invest in all developed markets excluding the U.S. Remember to look under the hood or you might be inadvertently excluding major countries from your global equity opportunity set.

To learn more about the comprehensive coverage of the S&P Global BMI Index Series, see The S&P Global BMI: Providing Consistent Insights into Global Equity Markets since 1989.

The posts on this blog are opinions, not advice. Please read our Disclaimers.
While Fixed Income Yields Remain Low, Theta Gang Generates Income through Covered Calls

Contributor Image
Berlinda Liu

Former Director, Multi-Asset Indices

S&P Dow Jones Indices

In response to the economic ravages of COVID-19, central banks and investors around the world went on a bond buying spree, pushing fixed income yields down and complicating the search for portfolio-generated income. While yields are generally off their March 2020 extremes, by historical standards they remain quite diminished.

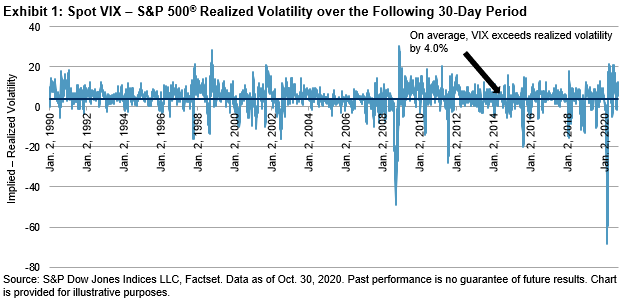
One alternative strategy to generate supplemental income from long-horizon portfolios is to sell covered calls on the holdings of structurally long exposures. This takes advantage of implied volatility in option prices exceeding that of subsequently realized volatility on average.

Alas, typical covered call strategies tend to underperform significantly in strongly upward-trending markets (such as in 2019) or when a sharp downturn is immediately followed by a quick rebound (March-April 2020). In both cases, the options written would be exercised and the holdings called away, costing an investor dearly by not participating in the market’s upside.

The trick, then, is to find a way to generate sufficient income in calm markets to offset any gains given up, and to limit the upside surrendered during rebounds. The S&P 500 18% Daily Risk Control Covered Call 103% Strike Index illustrates one way to accomplish that. While the name is rather unwieldy, let’s look at each of the ingredients it comprises and how they come together:

  • First, start with the S&P 500.
  • Next, add 18% daily risk control. Risk control increases leverage when volatility is low, and decreases leverage when volatility is high, in order to match a given volatility target (variants exist from 5% up to 18%; 18% was chosen here to generally match the historical volatility of the S&P 500).
  • Finally, sell monthly covered calls struck at 103% of the risk controlled index’s level.

So why go through the trouble of adding risk control if only to target the usual volatility of the S&P 500? Because now the covered calls are based on the exposure of the risk-controlled index: exposure that dynamically increases in calm markets and automatically reduces when markets turn volatile.1

When markets begin selling off and increase in volatility, the calls currently being held would have been sold with a strike above the highs, the same as with a normal call writing program. But rather than continuing to sell calls on the full portfolio through the (eventual) nadir, the risk control overlay typically reduces exposure, and thus fewer calls are sold, which means less of the eventual upside is called away. As markets rebound, volatility tends to recede, allowing the risk control index to add exposure—and new calls, at higher strikes, to be written.

This doesn’t completely offset the consequences of selling calls in an upward market, but it does narrow the spread significantly when compared to standard call writing strategies. However, combined with the added exposure of the risk control index in calm periods, it historically not only has generated more premium income than standard call writing strategies, but outperformed the base indices. While bulls and bears endlessly debate market direction and political winds, theta gang can quietly take advantage of higher implied volatility, generating supplemental income and added value over time.

1 The construction of the covered call index uses synthetic call options (priced with a transaction volatility cost of 150 bps) written on the risk control index. In practice, it’s far more likely, and more practical, to dynamically trade options on the S&P 500 itself to match the exposure of the risk control index.

The posts on this blog are opinions, not advice. Please read our Disclaimers.