Get Indexology® Blog updates via email.

In This List

Manage Drawdown and Recovery with Dynamic Allocation

Unsung Stories of 2020

Indexing Biodiversity: Examining Water as an Asset Class

Performance of Indian Capital Markets in 2020

Oscillations in Opportunity

Manage Drawdown and Recovery with Dynamic Allocation

Contributor Image
Claire Yi

Former Analyst, Strategy Indices

S&P Dow Jones Indices

In October 2019, S&P Dow Jones Indices launched the S&P ESG Global Macro Index, an ESG-themed, regionally diversified, volatility-managed, multi-asset index. As discussed in my previous blog, the index has generated stable absolute returns of 5.44% annually, a volatility of 4.89%, and downside protection during extreme market scenarios, based on back-tested performance from Aug. 31, 2010, to Dec. 31, 2020.

The global equities market experienced unprecedented fast drawdown and recovery in 2020. Although the S&P ESG Global Macro Index’s performance was not as stunning as that of the S&P 500® in 2020, it outperformed a pure equity and static 60% equity/40% bond portfolio with a risk control mechanism.1 This blog reviews how the S&P ESG Global Macro Index’s dynamic asset allocation helped to achieve this outcome.

Economic- and Market-Signal-Based Allocation

The S&P ESG Global Macro Index uses a short-term economic movement signal and a medium-term market trend signal to revise its asset allocation on a monthly basis (see brochure).  Exhibit 2 provides the timeline of allocation signals of the S&P ESG Global Macro Index in 2020. There were three different phrases.

Phase 1: Before Sell-Off

At the beginning of 2020, the Organization for Economic Co-operation and Development’s composite leading indicator (the OECD’s CLI) was below 100, indicating economic activity was below its long-term potential level. Although the three-month momentum of the equity market was still positive, the index allocated 55% to equities and 45% to fixed income.

Phase 2: COVID-19 Sell-Off

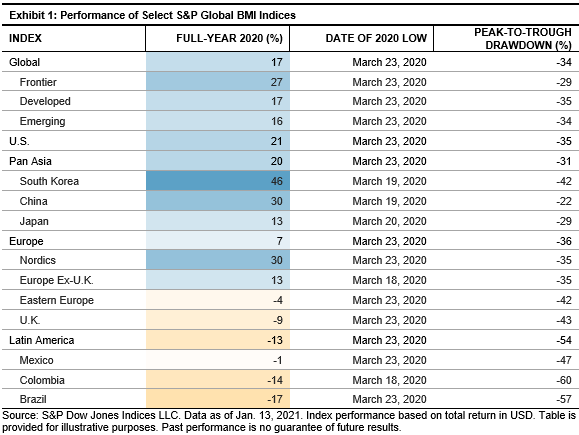
The sell-off started on Feb. 19, and hit bottom on March 23. The S&P 500 declined 33.93% in 23 trading days. The S&P ESG Global Macro Index reduced its equity allocation from 55% to 0% on March 1, as the momentum signal turned negative during that month’s rebalance.

Phase 3: Recovery

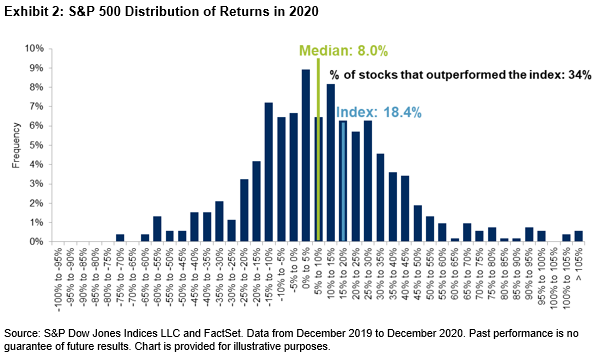
On Aug. 18, the S&P 500 completely erased its February-March 2020 losses, calling an end to the COVID-19-driven plunge. As the market signal turned positive on July 1, the index reassigned a 55% weight to the equity basket to capture the upside potential gain from equities.

Risk Control Mechanism

After the monthly allocation is determined, the S&P ESG Global Macro Index applies a 5% risk control overlay by adjusting a leverage factor applied to the overall portfolio in order to achieve a stable risk at the index level. Exhibit 3 shows the allocation to each asset class after applying 5% risk control. There were three periods worth noting.

Period 1: From Feb. 19 to March 10, when the market started to fall in response to COVID-19, there was a clear negative relationship between equities and fixed income. The S&P 500 dropped 14.88% while the bond component2 gained 3.83% in 14 trading days. Before March, the index had a decreased leverage factor for protection. As the index switched to the bond portfolio starting March 1, it was leveraged. This is because the 100% bond portfolio’s volatility was less than 5%. The leverage resulted in a 2.3% return for the index from March 1 to March 10.

Period 2: From March 11 to 23, as oil prices fell, the negative relationship did not hold. The S&P 500 dropped 22.37%. During the same period, the bond stopped acting as a safe heaven and dropped by 1.37%, and the realized volatility of the all-bond portfolio was higher than 5%. The S&P ESG Global Macro Index thereby reduced its bond exposure by lowering the leverage factor and returned -1.30% during those nine trading days.

Period 3: After March 24, the market started to rebound, and the bond portfolio’s volatility decreased gradually. In response, the index continued to increase the leverage factor to maintain the 5% target volatility. From March 24 to June 30, the index kept its portfolio configuration unchanged, while increasing the leverage factor from 0.52 to 1.35. On July 1, the equity basket was added back to the index based on the positive market signal. The new equity/bond portfolio had a volatility higher than 5%. Thus, the index used a smaller leverage factor to maintain a stable level of risk, resulting in a 20.08% actual allocation to equity.

During volatile periods, especially in undesirable macroeconomic conditions, a dynamic allocation strategy, which balances risk and return during drawdowns and recoveries, could be worth consideration.


1 Risk control is commonly used in structured product’s underlying methodology, and a higher citation like 10% or 15% may lead to higher returns.

2 Represented by the index bond basket, including the S&P 10-Year U.S. Treasury Note Futures Index, S&P Euro-Bund Futures Index, and S&P 10-Year JGB Futures Index, following a ratio of 3:2:1.

The posts on this blog are opinions, not advice. Please read our Disclaimers.

Unsung Stories of 2020

Contributor Image
Sherifa Issifu

Senior Analyst, U.S. Equity Indices

S&P Dow Jones Indices

Early in 2020, global stock markets acted in concert during the sell-off, bottoming out around the world in late March. However, the extent to which different markets declined, and the strength of the subsequent recovery, differed significantly around the world. With 2020 now in hindsight, S&P DJI’s range of global equity indices tell a tale of distinctive performances, as well as a returning importance of swings in the currency markets.

On the surface, it was a good year: the S&P Global BMI finished with a full-year total return of 17% in U.S. dollars, with both emerging and developed components performing similarly. However, Latin America, Eastern Europe, and the U.K. closed 2020 lower—driven by risk-off sentiment and an initial move to safety that led to their slower recoveries. Meanwhile, the Nordic markets outperformed, while China and South Korea soared.

As shown in Exhibit 1, most of the 2020 lows occurred nearly simultaneously around March 23, 2020, but the scale of the drawdown, and the timing and speed of the recoveries, differed greatly.1 Exhibit 2 gives a more granular picture, plotting the time taken by a range of countries to get back to winning ways. Northern European countries were among the first to return to their highs, with Denmark taking just over two months to do so, and recovery times across the Scandinavian region averaging only four months. However, the global recovery really began with China: the S&P China BMI saw a smaller drawdown in March, setting a lower hurdle for redemption. The index took approximately three months to regain its losses—kicking off a wave of subsequent stock market highs. At the bottom of the spectrum, many Latin American countries and the U.K. still have some catching up to do.

Currency was a major factor in the performance of some markets, and Brazil in particular. In local currency terms, the S&P Brazil BMI had a respectable gain of 6%, but it declined 17% in U.S. dollar terms, driven by a 23% weakening of the Brazilian real (BRL) in 2020. A similar impact from currency meant 2020 gains dwindled when converted into U.S. dollars across several emerging markets, including Russia, Turkey, and Mexico. Part of this disparity was a result of the differences in the ability of countries to provide stimulus to their economies during the COVID-19 pandemic—as not every country could do “whatever it takes.”

Exhibit 3 shows that the currency markets hosted big winners as well. The S&P Europe BMI was lifted to a positive return (in U.S. dollar terms) entirely thanks to currency movements, after a 9% swing in the euro versus the U.S. dollar in 2020. There were similarly large moves for the greenback among a range of developed market currencies, including the Australian dollar (AUD) and the Nordic currencies (SEK and DKK).

Overall, 2020 was a rocky year for global markets, but with 2021 starting off on a positive note and signs of strong recoveries in the cyclical sectors that dragged down returns last year, we should see more country and regional equity markets fully recover from the 2020 sell-off and begin to write new stories for the year.


1 We define a recovery as the first point at which each index posted a new high for the year subsequent to its March 2020 low.


The posts on this blog are opinions, not advice. Please read our Disclaimers.

Indexing Biodiversity: Examining Water as an Asset Class

Water is one of the world’s most essential commodities, but it is at risk from overuse, pollution, and soaring demand. S&P DJI’s Tianyin Cheng joins Redsand Ventures’ Colleen Becker to explore new tools for understanding and accessing water assets.

Learn more: https://www.spglobal.com/spdji/en/education/article/investing-in-water-for-a-sustainable-future

The posts on this blog are opinions, not advice. Please read our Disclaimers.

Performance of Indian Capital Markets in 2020

Contributor Image
Ved Malla

Associate Director, Client Coverage

S&P Dow Jones Indices

Indian capital markets had an exceptional year in 2020. The COVID-19 pandemic initially had an adverse impact on Indian capital markets, as indices across size and sectors fell during the period from February 2020 to May 2020. However, from June 2020 onward, all size and sector indices had a bull run through the end of the year. The S&P BSE SENSEX TR increased from 60,211.40 on Dec. 31, 2019, to 70,543.23 on Dec. 31, 2020—a one-year absolute return of 16.31%.

Exhibit 1 and 2 showcase returns for India’s leading size indices in 2020.

From Exhibits 1 and 2, we can see that all five size indices performed well, and returns were promising for large-, mid-, and small-cap segments. The returns of the small-cap and mid-cap segments were better than those of the large-cap segment. The S&P BSE SmallCap and S&P BSE MidCap posted one-year absolute returns of 33.53% and 21.31%, respectively, while the S&P BSE LargeCap and S&P BSE SENSEX returned 16.31% and 17.16%, respectively.

Exhibits 3 and 4 showcase returns for the 11 leading sector indices for India in 2020.

In Exhibits 3 and 4, we can see that most of the sector indices posted promising returns in 2020. The S&P BSE Healthcare and S&P BSE Information Technology performed exceptionally in 2020, with absolute returns of 62.61% and 60.05%, respectively. The S&P BSE Finance and S&P BSE Utilities were the worst-performing indices in 2020, with absolute returns of 1.25% and 4.18%, respectively.

To summarize, we can say that except for the couple of months at the beginning of the COVID-19 pandemic, the bulls had their way in 2020, and indices across size, segments, and sectors gave promising returns in 2020.

The posts on this blog are opinions, not advice. Please read our Disclaimers.

Oscillations in Opportunity

Contributor Image
Anu Ganti

U.S. Head of Index Investment Strategy

S&P Dow Jones Indices

2020 was a year of two reversals for the market. First, equities recovered from the depths of March to finish the year strongly, and second, smaller-cap and value stocks staged a roaring comeback in the final quarter.

We can better understand the second reversal by analyzing the market’s distribution of returns and the performance of stocks relative to the index as a whole. Exhibit 1 illustrates this for the S&P 500® for the past 20 years. Of the 980 stocks that were in the index during this period, only 211, or 22%, outperformed. When only 22% of the stocks beat the market, stock picking is hard, underscoring the persistent underperformance of most active managers.

Exhibit 1 summarized 20 years of data, but we also see the challenges of stock selection in most individual years, and 2020 was no exception. Exhibit 2 shows that the S&P 500’s return for 2020 (18.4%) was much higher than the median stock’s return of 8%. The outperformance of large-cap stocks meant that only 34% of stocks beat the index.

However, the path for stock-pickers was not a straight one in 2020. Exhibit 3 shows that from Q1 through Q3, the S&P 500 posted a return of 5.6%, as mega-caps outperformed during the period. As a result, only 35% of stocks were able to outperform the index.

In contrast, in Q4, the market reversed course, where the S&P 500’s return of 12.2% was much below the median of 17.1%, signaling the recovery of smaller-cap stocks. Therefore, 60% of stocks were able to outperform the index, almost double what we saw in the first three quarters.

This analysis has interesting implications for active management: The dominance of mega-caps hindered stock selection from Q1 through Q3. Meanwhile, in Q4, the comeback of smaller caps lowered the threshold for success, leading to a greater hit rate of outperforming the index. It is not solely the distribution of returns, but the return distribution across the cap range that matters.

As most active portfolios are closer to equal than cap weighted, it is also important to remember that smaller-cap outperformance favors equal-weight indices, which led to S&P 500 Equal Weight’s recent reversal. If the trends from Q4 continue, we can anticipate a more favorable environment for active managers. Whether they will be able to take advantage of it remains to be seen.

The posts on this blog are opinions, not advice. Please read our Disclaimers.