Get Indexology® Blog updates via email.

In This List

Big Sector Shifts in Low Volatility Composition

Symbiotic Sentiments

Sector Spotlight: Healthcare in India

VIX Back to Normal? Not Really

Outcome-Oriented Solutions: Where Active and Passive Meet

Big Sector Shifts in Low Volatility Composition

Contributor Image
Fei Mei Chan

Former Director, Core Product Management

S&P Dow Jones Indices

In March, COVID-19 inspired volatility roiled markets across the globe. Similarly, the volatility of the S&P/TSX Composite also jumped. The increase, however, was not balanced across all sectors. We see this manifested in the most recent rebalance for the S&P/TSX Composite Low Volatility Index.

Effective after the close of trading April 24, 2020, Exhibit 1 reflects the sector allocation of the low volatility index. Thirty of the 50 names were replaced in the index, for a weight change of 56%. (For context, median annual turnover for the index is 60%.) Needless, to say this reflects a quarter of major commotion.

Notably, we saw a significant scaling back of Real Estate (-16%), Utilities (-12%), and Financials (-11%). In their place, Industrials (+19%) and Consumer Staples (+10%) rose as the two highest allocations of the index.

S&P DJI’s low volatility methodology does not apply constraints around sector allocations.  Though the low volatility index searches for the lowest volatility at the stock level, sector allocations (as shown in Exhibit 2) can sometimes offer context around where things are relatively more stable. Not surprisingly, Energy, Utilities, and Financials experienced the biggest spikes in volatility, and all are on the higher end of the volatility spectrum while Consumer Staples and Industrials are relatively less volatile.

The posts on this blog are opinions, not advice. Please read our Disclaimers.

Symbiotic Sentiments

Contributor Image
Anu Ganti

U.S. Head of Index Investment Strategy

S&P Dow Jones Indices

Sectors and factors are different ways of viewing the world, but they are not mutually exclusive.  We find an example of such a close, symbiotic relationship between the technology sector and the quality factor.  Exhibit 1 shows that the S&P 500 Information Technology index has a strong tilt towards quality, while the biggest overweight in the S&P 500 Quality Index is towards information technology.

Source: S&P Dow Jones Indices LLC and FactSet. Data as of April 2020. Chart is provided for illustrative purposes.

Both technology and quality have outperformed during both calendar 2020 and the 12 months ending April 30.   This raises an obvious question: Has technology done well because of its exposure to quality, or has quality done well because of its exposure to technology?

We begin our inquiries by calculating quality scores for all the constituents of the S&P 500, based on the following metrics: return on equity, financial leverage and accruals ratio.  We then rank the constituents by their quality score, and slice the S&P 500 into quality quintiles.  Finally, we analyze how much of S&P 500 Info Tech’s weight is in each of these quintiles.

Exhibit 2 illustrates that an astonishing 70% of S&P 500 Info Tech’s weight is in the top quality quintile.

Source: S&P Dow Jones Indices LLC and FactSet. Data as of April 2020. Chart is provided for illustrative purposes.

Quality is clearly important to the technology sector, but how important is technology to the quality factor? To answer, we turn the tables and look at technology’s weight in the S&P 500’s top quality quintile.

We observe in Exhibit 3 that 53% of the capitalization of the top quality quintile in the S&P 500 is in technology, dominating the other sectors.  But an even greater share – 70% – of large-cap technology comes from the top quality quintile. Therefore, we can conclude that quality’s influence on technology is greater than technology’s influence on quality.

Source: S&P Dow Jones Indices LLC and FactSet. Data as of April 2020. Chart is provided for illustrative purposes.

Both S&P 500 Info Tech and the top quality quintile of the S&P 500 are highly concentrated, as we see in Exhibit 4. While the five largest names in Info Tech are all in the top quality quintile, only three out of the five largest names in the top quality quintile are in Technology, further confirming our conclusion that quality’s influence on technology outweighs technology’s influence on quality.

Source: S&P Dow Jones Indices LLC and FactSet. Data as of April 2020. Chart is provided for illustrative purposes.

While we cannot fully disentangle the overlap between the technology sector and the quality factor, the data argue that quality has greater significance to technology than the other way around. Understanding both perspectives is not only helpful, but also important to recognizing the intertwined relationship between sectors and factors.


The posts on this blog are opinions, not advice. Please read our Disclaimers.

Sector Spotlight: Healthcare in India

Is Healthcare providing a potential opportunity for Indian investors? Explore recent sector performance with S&P DJI’s Koel Ghosh and see how India’s Healthcare sector stacks up to broader markets.

Read more here: https://www.indexologyblog.com/2020/05/11/covid-19-revelations-health-care-is-wealth/

The posts on this blog are opinions, not advice. Please read our Disclaimers.

VIX Back to Normal? Not Really

Contributor Image
Berlinda Liu

Former Director, Multi-Asset Indices

S&P Dow Jones Indices

The U.S. equities market had a wild start in 2020. Following the March 2020 sell-off, the S&P 500® posted its largest monthly gain (12.8%) since 1987. Meanwhile, VIX® went from its long-term median to an all-time high within a month before it settled around 30. One thing that has been debated lately is whether VIX, often referred to as the “fear gauge,” has gone back to normal and indicates that the market has hit the bottom. To answer this question, we need to investigate several aspects of VIX and its related trading activities.

VIX Futures Curve Not Completely Back to Contango

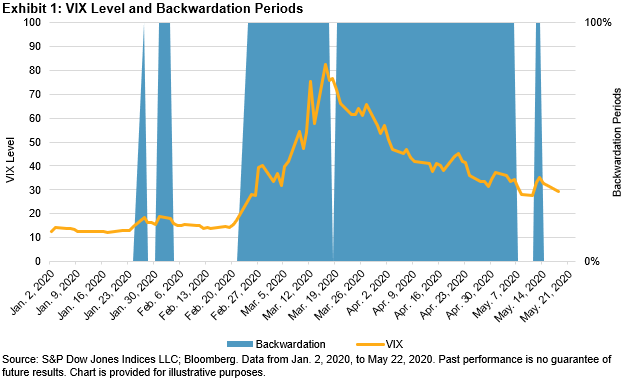
As pointed out in a recent VIX paper from the CFA Institute Research Foundation, the VIX futures curve is in contango about 80% of the time and usually goes into backwardation in distressed markets. On Feb. 24, 2020, the VIX futures curve flipped into backwardation, and it kept this downward sloping shape until May 6, 2020—the shaded area in Exhibit 1 shows the backwardation period of the VIX futures curve. However, the current price difference between the first- and second-month VIX futures is small, and the curve is more flat than upward sloping. In fact, the futures curve went back to mild backwardation on May 12 and May 13, 2020. This is unlike typical contango in VIX term structure.

VIX Level Remains Elevated

On Feb. 21, 2020, VIX closed at 17.08, near its long-term median of 17.27. In less than a month, it skyrocketed to an all-time high of 82.69. As of May 22, 2020, it was hovering around 30. Although this most recent level seems rather tame compared with its March peak, investors should understand that the current VIX readings are around its 90th percentile level of 28.7.

History has demonstrated that although volatility may rise rapidly, it often declines slowly. In other words, the market tends to remain volatile for a while after a shock occurs. A VIX level of 30 implies annualized volatility of 30%, or daily moves of 1.9% in the market during the next 30 days. Given that the S&P 500 has moved about 0.76% daily on average since 1990, the current VIX level implies that investors collectively anticipate outsized daily moves, at least in the short term.

VIX Derivatives Trading Volume

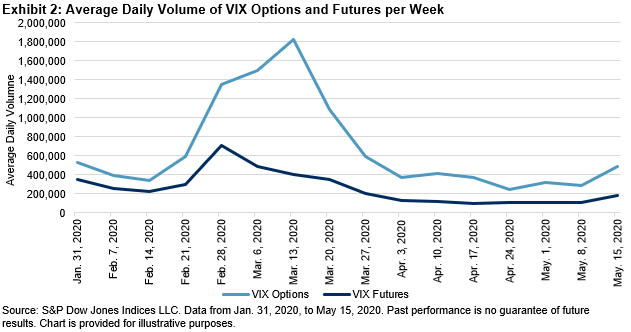
Derivatives trading on VIX dropped from its March peak, but it picked up again during the week of May 15, 2020. VIX options’ average daily volume (ADV) during the week of May 15 was only a quarter of the ADV during the week of March 13; however, it almost doubled the ADV from the week of April 24. The pickup in trading volume was accompanied by a jump in VIX levels and futures prices, indicating that investors were pricing elevated risk into June 2020 contracts. This is not surprising given that many states were positioned to reopen their economies after May 15, 2020.

Conclusion

It is yet to be seen whether reopening the U.S. economy will fuel a resurgence of COVID-19 cases. On top of that, President Trump’s statement to cut ties with the second-largest economy in the world cast an additional shadow over the market outlook. The VIX levels, futures curve, and trading activities seem to tell us that, despite the improved optimism in the market, elevated risk is likely to be the new norm, at least for a short while.


The posts on this blog are opinions, not advice. Please read our Disclaimers.

Outcome-Oriented Solutions: Where Active and Passive Meet

Contributor Image
Pavel Vaynshtok

Former Managing Director, Global Head of Strategy Indices

S&P Dow Jones Indices

What do presidential debates and an argument between passive and active investors have in common? They are both thrilling, demand the highest levels of rhetorical skills, don’t change audience opinions, and everyone goes home entertained. While presidential debates remain as exciting as ever, the shrillness of conversation between active and passive investors seems to have lessened. One could argue that this change is due to (1) a smaller degree of outperformance of star managers, (2) a convergence of fee differentials, and (3) the investment industry widening its focus to offer more solutions.

Performance

One of the drivers behind the shift in capital from active to passive is the question of active managers’ ability to outperform their benchmarks. Here, the burden of proof has fallen squarely on active managers. While there are, indeed, a few active managers who outperform, S&P DJI’s SPIVA® U.S. Scorecard[1] highlights that the last time the majority of all active U.S. managers outperformed was in 2013. In 2019, a full 70% of all active U.S. investors underperformed.

Based on the SPIVA Scorecard, some areas of the market are relatively easier for alpha generation than others. Over the past 10 years, on a net-of-fees basis, 63% of international small-cap (ISC) managers underperformed their benchmark, while the number for the U.S. large-cap core (LCC) was 97%. While there are periods of outperformance for a median manager, alpha is volatile and mostly negative (see Exhibit 1).

While the alpha generation of median managers is underwhelming, what about the best-performing investors? Let’s look at the top-quartile managers (see Exhibit 2). Identifying top managers a priori is, of course, unrealistic, and many strategies don’t survive—only 50% of LCC and 60% of ISC funds that existed 10 years ago are still live.[2] However, even with the benefit of perfect hindsight, what we want to analyze is whether we can discern any change in the magnitude of alpha for the best managers.

Top investors are still able to generate excess returns, although the downtrend is apparent, and persistence of this alpha is fleeting.[3]

Convergence of Fee Differentials

Many of us are aware of the pressure that active and, more recently, passive investors have been under with respect to the structural decline in fee levels. Technological and analytical advances contributed to increasing economies of scale and brought up a heightened investor focus on sources of performance. As fees continue to march lower (with the differential dropping by about one-third since 2000), the contrast between active and passive has become less pronounced (see Exhibit 3).SPIV

Both Passive and Active Are Focusing on Solutions

As healthcare and college costs continue to march higher, and as the burden of saving for retirement has shifted from employers to employees, the investment industry has repositioned itself. Managers are evolving beyond long-only, asset-class-specific strategies. Instead, outcome-based solutions such as target date funds, 529 plans, and income guarantee products have proliferated.

One can argue that the investment industry has morphed into a “manufacturing” industry: various solutions come to market that try to target a specific outcome. Contrast this with 10+ years ago, when many value propositions had to do with attempting to outperform a benchmark while maintaining a certain level of risk. Here at S&P DJI, we are actively engaging in providing index-based solutions such as our U.S. equity franchise, volatility indices, multi-factor and multi-asset approaches, thematic funds, ESG offerings, real assets, and custom indices.

Active and passive investors are opinionated groups. However, as the industry continues to shift and investment approaches evolve, we suspect that the two camps will continue to converge, heated discussions will become less so, and the focus will center more around providing appropriate solutions to investors regardless of the investment approaches.

[1] SPIVA U.S. Scorecard, Year-End 2019

[2] SPIVA Institutional Scorecard, Year-End 2018

[3] Soe, A., Can You Beat the Market Consistently?, 2019

The posts on this blog are opinions, not advice. Please read our Disclaimers.