Get Indexology® Blog updates via email.

In This List

COVID-19 Revelations – Health (Care) Is Wealth

Exploring Low Volatility over the Long-Term in India

S&P 500 Dividend Futures: Divining Time To Recovery

Who’s In? Who’s Out? Walmart & Twitter Dropped from the S&P 500 ESG Index, among Other Major Changes

Business as Usual for the S&P Paris-Aligned Climate Indices

COVID-19 Revelations – Health (Care) Is Wealth

Contributor Image
Koel Ghosh

Former Head of South Asia

S&P Dow Jones Indices

In the battle against the COVID-19 pandemic, the importance of healthcare has gained significance. Markets are witnessing new trends across asset classes, while meeting new challenges. Asset-allocation strategies are being reviewed to adjust to the new conditions. Equity sectors are facing the heat of these unprecedented times, but some trends are similar for both global and Indian markets.

The Health Care sector has been one such case. Not only has it outperformed over these past few months of uncertainty, but it also has had a good historical track record. Comparing the Health Care sectors of the Indian and U.S. markets, similar trends of outperformance versus their benchmarks were visible over different time periods. In the U.S. market, the Health Care Select Sector, which consists of all components of the S&P 500® that are classified in the Health Care sector, had a 10-year annualized return of 14.63%, as compared with an 11.69% return from the S&P 500. In Indian markets, the S&P BSE Healthcare had a 10-year annualized return of 11.11%, as compared with a 6.74% return from the S&P BSE SENSEX (as of April 30, 2020). A study on the Australian market and its Health Care sector performance relative to its benchmark showed similar trends (read more here).

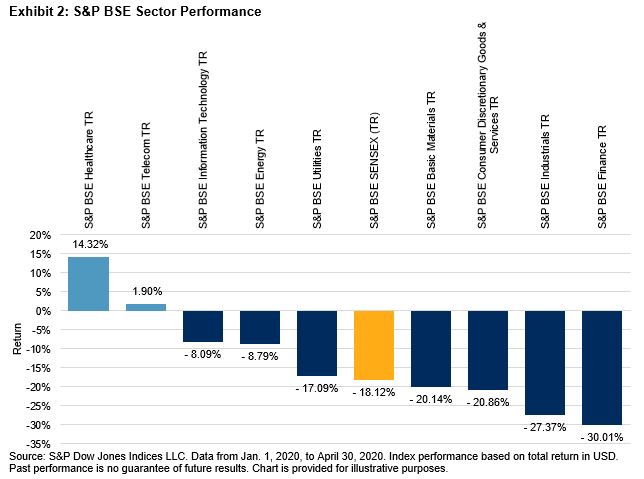
A comparison of the Health Care sector performance since January 2020 revealed that the majority of the sectors in the S&P BSE SENSEX, other than Health Care and Telecommunications, underperformed, including the S&P BSE SENSEX itself. The S&P BSE Finance, at -30.01%, and S&P BSE Industrials, at -27.27%, reflected the top sector laggards. The S&P BSE SENSEX, at -18.12%, was well below the S&P BSE Healthcare, which returned 14.32% for the period from Jan. 1, 2020, to April 30, 2020.

Taking an overview of this sector relative to other Indian benchmarks, such as the S&P BSE 100 and S&P BSE 500, further reflected the consistent outperformance of the S&P BSE Healthcare.

Of the 69 constituents in the S&P BSE Healthcare, the top 10 constituents were 65.53% of the total index weight as of April 30, 2020. Sun Pharmaceutical Industries Ltd and Dr. Reddy Laboratories, with index weights of 13.33% and 12.65%, respectively, constituted the top weights in the index.

The posts on this blog are opinions, not advice. Please read our Disclaimers.

Exploring Low Volatility over the Long-Term in India

How does the low volatility factor respond to periods of crisis and do the results tend to hold over the long term in India? S&P DJI’s Koel Ghosh takes a closer look at the low volatility anomaly in India.

Read more here: https://www.indexologyblog.com/2020/03/24/low-volatility-strategies-in-times-of-high-volatility/.

The posts on this blog are opinions, not advice. Please read our Disclaimers.

S&P 500 Dividend Futures: Divining Time To Recovery

Contributor Image
Tim Edwards

Managing Director, Index Investment Strategy

S&P Dow Jones Indices

In 2019, the S&P 500® companies in aggregate paid a record $485 billion in dividends.  This year, the figure could be closer to $415 billion, and it could be another seven years before they recover to 2019 levels, according to futures prices.  Dividend futures, that is.

Index futures based on the level of the S&P 500 may be more familiar than those based on its dividends, but there is a simple connection between the two.  An arbitrage mechanism connects index futures prices to current (“spot”) values of the S&P 500; the difference between spot and futures prices depends on the difference between interest rates and dividend yields until expiry of the future.  Interest rates are knowable in advance; dividend payments are not.  Dividend futures are designed to hedge this uncertainty.

In 2015, the CME launched a futures contract based on the annual dividends paid by a portfolio tracking the S&P 500.  Today one can trade any of 11 contracts stretching out to the year 2030, with pricing based on “index points”; in 2019, for example, S&P 500 dividends amounted to 52.2 index points (versus an average S&P 500 index level of 2,913).   Each year’s contract is settled at the total dividend points paid during that calendar year.

Stock prices usually move faster than fundamentals, and dividend futures are typically more stable than stock index futures.  Not this year, however: the peak-to-trough decline in the 2020 S&P 500 dividend future in 2020 was 37%, compared to only 34% for the S&P 500.  Having fallen further, the dividend future then lagged the recovery afterwards.  The S&P 500 closed yesterday around the same level it began last October; the 2020 dividend future is still 15% lower.

The collapse in 2020 dividend expectations is more extreme considering that some dividends have already been paid this year: in the first quarter, aggregate S&P 500 dividends were still breaking payout recordsLooking at the next contract out, the 2021 futures contract is currently priced at 44 – another 12% below this year’s future – and is perhaps a better guide as to what dividend run rate to expect in the medium term. 

The existence of dividend futures ranging out several years allow us to make comparisons with total dividends paid historically and anticipated in coming years.  To put the information expressed by futures prices in a tangible context, using the same mathematics that converts an index level to the aggregate capitalization of all the index constituents, we can express the prices of dividend futures in terms of the total dollar amounts of dividends paid out by the companies in the S&P 500.  Exhibit 2 illustrates the conversion from annual futures prices into total aggregate dividends, in comparison to historical payments to shareholders.

Of course, futures prices are not perfect predictions. The dividend futures markets may be overly pessimistic – they have tended to underestimate payouts historically.  But there are plenty of reasons to suppose that prices should recover faster than dividends.  Declining U.S. Treasury yields offer a justification for valuations to increase faster than fundamentals (as discount rates fall), while dividends themselves may prove less popular with some shareholders and CEOs during a time of economic uncertainty.  Time will tell, but if we take futures prices as imperfect guides, it seems fair to conclude that S&P 500 dividend payments could slow considerably in the short term and take quite a few years more to recover.

The posts on this blog are opinions, not advice. Please read our Disclaimers.

Who’s In? Who’s Out? Walmart & Twitter Dropped from the S&P 500 ESG Index, among Other Major Changes

Contributor Image
Mona Naqvi

Global Head of ESG Capital Markets Strategy

S&P Global Sustainable1

After markets closed on April 30, 2020, the S&P 500® ESG Index underwent its second annual rebalance since it launched in January 2019. Last year, the rebalance resulted in some changes that hit the headlines—most notably, the removal of Facebook from the sustainable version of the iconic S&P 500. With markets currently in turmoil due to the outbreak of COVID-19, interest in ESG is at an all-time high.[1] Thus, the big question, “Who made the cut?” is perhaps more relevant now than ever before.

First, let’s quickly recap the index and its objectives. The S&P 500 ESG Index aims to retain as many companies from the S&P 500 as possible, after removing certain companies—based on ESG principles—and re-weighting those that remain by market capitalization. Companies are excluded if they have a low ESG score relative to global industry peers, are involved in controversial weapons or tobacco, perform poorly on the principles of the UN Global Compact, or are involved in controversies deemed material to their ESG performance (according to S&P Global’s Media & Stakeholder Analysis). After making these exclusions, the methodology targets 75% of the market cap within index industry groups, selecting the best ESG performers using the S&P DJI ESG Scores.[2] Therefore, companies might not qualify because they are: (a) ineligible or (b) simply not selected, even if they are eligible, because of poor S&P DJI ESG Score performance relative to their peers.[3]

Constituent Selection

As of the 2020 rebalance, 311 constituents made it into the S&P 500 ESG Index, with 56 companies classified as ineligible and 138 as eligible but not selected. Exhibit 1 highlights how the S&P 500 translated into the composition of the S&P 500 ESG Index in 2020.

But what has really changed since the last annual rebalance? Exhibit 2 highlights the biggest additions and drops this year in terms of market capitalization.

Other household names that were dropped from the index include Clorox, Twitter, Equifax, Ford Motor Company, ViacomCBS, Nordstrom, and Southwest Airlines. These were mostly eligible but simply not selected. However, Equifax and ViacomCBS were excluded for ranking in the bottom 25% of their industry group S&P DJI ESG Scores, globally, while Twitter was ineligible due to a low UNGC score. Meanwhile, American Airlines Group, Royal Caribbean Cruises, and DTE Energy were just some of the well-known companies that were added. A handful of companies that were dropped in October 2019 due to their involvement in controversies, namely Johnson & Johnson, 3M, and DuPont, were unable to rejoin, as the methodology prevents companies removed for this reason from reentering the index for one full calendar year. Notwithstanding the recent additions and drops, numerous names remained out of the S&P 500 ESG Index for failing to meet the rules-based selection criteria in both 2019 and 2020. Exhibit 3 highlights the biggest companies to remain out of the S&P 500 ESG Index this year.

Results & Performance

The S&P 500 ESG Index achieved a 21.17% boost in its aggregate S&P DJI ESG Score performance compared with the S&P 500—with numerous positive impacts pertaining to issues like female representation in management positions, greenhouse gas emission reduction targets, effective risk culture, and many more. The S&P 500 ESG Index achieved these impacts with 83 bps of tracking error over the past five years and excess returns of 0.53% over the same period.[4] However, since the five-year return figure includes history that was built before the index was launched, it is worth paying special attention to the past one–year period, over which timeframe the S&P 500 ESG Index exhibited excess returns of 2.68% against the benchmark S&P 500, with 1.09% of tracking error (see Exhibit 4).

It is important to note that the objective of the S&P 500 ESG Index is not to outperform the benchmark. Instead, the S&P 500 ESG Index is designed to maintain similar overall industry group weights as the S&P 500, while at the same time achieving a boost in S&P DJI ESG Score performance with measurable, positive impacts. In spite of the recent market volatility, however, the rules-based and beta-like S&P 500 ESG Index—driven by ESG principles—has indeed delivered, along with some welcome upside performance.[5]

[1]   ESG funds experienced record inflows in 2019 (for example, see articles from CNBC, Citywire, and Morningstar), while numerous reports highlighted the outperformance of ESG strategies in Q1 2020 and Q2 2020, despite high market volatility (for example, see articles from Responsible Investor, Reuters, The FT, and S&P Global Market Intelligence). Several reports have also pointed to the growing importance and interest in ESG in light of the spread of COVID-19 (for example, see articles from Forbes, Schroders, AlphaSense, and Investment News).

[2]   To learn more about S&P DJI ESG Scores, please visit https://spdji.com/topic/esg-scores.

[3]   To learn more about the S&P ESG Index Series Methodology, please review the methodology document, available at: https://spdji.com/documents/methodologies/methodology-sp-esg-index-series.pdf.

[4]   Based on hypothetical historical total returns index performance. The S&P 500 ESG Index was launched on Jan. 28, 2019.

[5]   To learn more about the recent outperformance of the S&P 500 ESG Index, see https://www.indexologyblog.com/2020/03/24/through-the-turbulence-a-new-breed-of-esg-indices-delivers/

The posts on this blog are opinions, not advice. Please read our Disclaimers.

Business as Usual for the S&P Paris-Aligned Climate Indices

Contributor Image
Leonardo Cabrer

Director, Global Research & Design

S&P Dow Jones Indices

On April 20, 2020, the S&P Eurozone LargeMidCap Paris-Aligned Climate Index (S&P Eurozone PA Climate Index) was launched (see press release). This index has been designed to align with recommendations from the Task Force on Climate-related Financial Disclosures and follow the new minimum standards for EU Paris-Aligned Benchmarks proposed by the EU,[1] while remaining as close as possible to its benchmark index, the S&P Eurozone LargeMidCap.

The current market conditions have put the effectiveness of the index methodology to the test. One of the main requirements of the regulation is that the carbon intensity of the index adheres to a strict trajectory of 7% reduction year-on-year.

In this short piece, we will analyze the impact of the recent market movements on the carbon intensity of the S&P Eurozone PA Climate Index and whether this has impeded the index’s ability to meet its 7% decarbonization goal.

First, we need to ask ourselves: why does market movement affect the index’s carbon intensity?

There are several approaches to measure the “carbon intensity” of a portfolio. The EU regulation stipulates that the carbon intensity of a company should be measured by dividing its Greenhouse Gas (GHG) emissions by its Enterprise Value Including Cash (EVIC). The index carbon intensity is the weighted-average carbon intensity (WACI) of its constituents. Therefore, when the EVIC of the index portfolio increases, the index WACI decreases and vice versa. Since the market capitalization of equities contributes substantially to EVIC, it is reasonable to assume that when the index level goes down, the carbon intensity of the index goes up.

In the first quarter of 2020, the S&P Eurozone LargeMidCap’s WACI (including Scope 3 emissions) increased by 18%. However, the chart shows that the main driver of this change was the 14% decrease in the average EVIC of its constituents (see Exhibit 1). Put simply, the recent market drop has made the carbon intensity of the index appear worse even without any companies necessarily increasing their GHG emissions.

The question remains: has the S&P Eurozone PA Climate Index remained below its decarbonization trajectory during this period? The answer is a resounding yes (see Exhibit 2).

The yellow line indicates the 7% decarbonization trajectory required for the S&P Eurozone PA Climate Index. The index has remained below its allocated trajectory for every quarter since its inception. We can see that in the two periods (December 2018 and March 2020) when the EVIC suffered substantial decreases (see Exhibit 1) the S&P Eurozone PA Climate Index’s WACI moved closer to its required trajectory, but never exceeded it.

The dependency of EVIC on WACI was already noted by the Technical Expert Group (TEG) recommendations. To ensure that GHG emissions change is the main driver of the decarbonization of any climate benchmark, the TEG proposed adjusting the WACI by the average index-level EVIC increase/decrease (see Exhibit 3).

Exhibit 3 shows that the S&P Eurozone PA Climate Index’s adjusted-WACI tracks the required trajectory closely. This is because the WACI adjustment for index-level EVIC changes is an integral part of the methodology (see page 12 of the methodology).

In short, since the S&P Eurozone PA Climate Index targets decarbonization using the adjusted-WACI approach, we can rest assured that significant changes in the benchmark index level will have little impact on it meeting its climate objectives.

Exhibit 3 also shows that S&P Eurozone LargeMidCap-adjusted WACI has only reduced 3.4% since December 2016, while the S&P Eurozone PA Climate Index has reduced its WACI by 25.7%, well below the 21.0% required by the trajectory for the same period, without overshooting the required trajectory.

In summary, the current market conditions have provided an excellent opportunity to test the robustness of the methodology behind the S&P Paris-Aligned Climate Indices. The S&P Eurozone PA Climate Index passed with flying colors and successfully maintained its climate objectives. Now, back to business as usual.

The posts on this blog are opinions, not advice. Please read our Disclaimers.