Get Indexology® Blog updates via email.

In This List

COVID-19’s Role in the Changing Landscape of Indian Capital Markets

How the Chinese Equity Market Responded to the Domestic and Global Coronavirus Outbreak

China: An Unlikely Stabilizer in Emerging Markets

Delivering Low Volatility Exposure to High Yield Bonds

Volatile Start to 2020 - What's Next?

COVID-19’s Role in the Changing Landscape of Indian Capital Markets

Contributor Image
Ved Malla

Associate Director, Client Coverage

S&P Dow Jones Indices

In the past five years, capital markets in India have witnessed bull and bear phases. The bulls accounted for most of the five-year period; however, Q1 2020 completely changed this landscape. Due to the COVID-19 outbreak, capital markets have taken a beating both globally and locally in India.

Exhibit 1 and 2 showcase the five-year returns for India’s leading size indices.

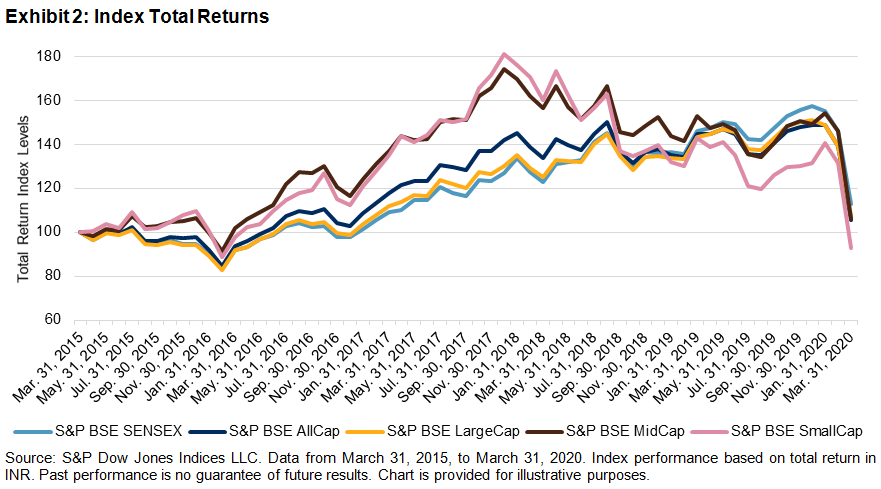
From Exhibits 1 and 2, we can see that the returns were promising for large-, mid-, and small-cap segments through December 2019; however, the scenario completely changed in Q1 2020. The returns of the large-cap segment were better than the small- and mid-cap segments across the five-year period. The S&P BSE SENSEX, which comprises the 30 largest and most liquid BSE-listed companies in India, outperformed all size indices.

Exhibits 3 and 4 showcase returns for the 11 leading sector indices in India in the past five years.

From Exhibits 3 and 4, we can see that the S&P BSE Energy and S&P BSE Fast Moving Consumer Goods posted promising returns, while the S&P BSE Healthcare, S&P BSE Telecom, and S&P BSE Industrials posted negative returns for the five-year period. All the sectors had negative returns in the Q1 2020.

To summarize, we can say that the bulls had their way during most of the five-year period across all sizes and most sectors through December 2019; however, due to the COVID-19 outbreak, things went south at Dalal street as markets tumbled across all sizes and all sectors during Q1 2020, especially during March.

The posts on this blog are opinions, not advice. Please read our Disclaimers.

How the Chinese Equity Market Responded to the Domestic and Global Coronavirus Outbreak

Contributor Image
Priscilla Luk

Managing Director, Global Research & Design, APAC

S&P Dow Jones Indices

As the coronavirus has spread across continents, countries around the world are experiencing a slowdown in economic activity and volatility in the financial markets. The S&P Pan Asia BMI and S&P 500® lost 20.5% and 20.0%, respectively,[1] in the first quarter of 2020. During the same period, the S&P China A Domestic BMI and S&P China 500 (which seeks to track the top 500 domestic and offshore listed Chinese companies) dropped 9.5% and 10.3%, respectively,[2] which was only half of the loss suffered by the U.S. and Pan Asian markets.

In response to the domestic coronavirus outbreak, the China A-shares market experienced a significant drawdown of 14.2% between Jan. 20 and Feb. 3, 2020, when the number of new cases of coronavirus infections in China was on the rise. However, the market has recovered most of its losses since Feb. 3, 2020, as a result of government stimulus packages and improved investor sentiment due to a slowing domestic infection rate.[3] Business activities began to pick up in China subsequently, and the National Bureau of Statistics announced the China Manufacturing Purchasing Managers’ Index rebounded to 52.0 in March from 35.7 in February. Nevertheless, global equity market sentiment turned to panic as investors expected a global recession due to the worsening coronavirus outbreak in the rest of the world. The S&P 500 and S&P Pan Asia BMI declined by 33.7% and 27.8%, respectively, between Feb. 20 and March 23, 2020, while the S&P China A Domestic BMI and S&P China 500 suffered smaller losses of 14.1% and 17.5%, respectively.

Before coronavirus infection accelerated in the rest of the world, the rate of domestic outbreak in mainland China was the determinant driver of the Chinese equity market performance. During the market decline between Jan. 20 and Feb. 3, 2020, the vast majority of industries suffered losses; however there was a significant spread in industry returns, from 3.2% to -17.9%. Health care equipment, health care technology, and biotech were top-performing industries due to the threat of the outbreak. As cities in China were locked down and travel was restricted to control the outbreak, airlines, retailers, restaurants, and hotels took a hard hit, while companies in interactive media, internet retail, and food and staples retailing were least affected. Semis, software, electronic equipment, and tech hardware companies were also less hammered by the domestic virus outbreak and they were among the top performers during the market rally between Feb. 3 and Feb. 20, 2020, when coronavirus infection rates slowed in mainland China.

The acceleration of coronavirus infection in the rest of the world, especially in the U.S. and Europe, heightened investor concern around a global recession, which was expected to also slow economic activity recovery in China. Based on companies in the S&P Total China Domestic BMI, electronic equipment, household durables, semiconductors, auto components, and tech hardware are the larger industries with high foreign revenue exposure, ranging from 29.9% to 58.7%. Revenues of these industries are more vulnerable to global economic slowdown compared to other industry peers. In contrast, interactive media, real estate management, and wireless telecom services have low exposure to foreign revenue, ranging from only 0.8% to 2.5%, and their revenues are dominated by domestic demand. In the recent global stock market crash (Feb. 20-March 23, 2020), the 10 industries with the highest foreign revenue share dropped 23.2%, while the 10 industries with lowest foreign revenue share only dropped 14.6%. Overall, only 14.4% of total revenue across all companies in the S&P Total China Domestic BMI are sourced outside of China, which implies that the revenues of these companies would largely follow the pace of domestic demand rather than international market demand. This was reflected in the smaller losses seen in the Chinese equity indices during the recent global market crash.

[1]   USD price returns between Dec. 31, 2019, and March 31, 2020.

[2]   USD price returns between Dec. 31, 2019, and March 31, 2020.

[3]   The spike in new infection cases on Feb. 12-13, 2020, was due to Chinese authorities changing the manner in which infection cases were tracked, aiming to include more cases for more timely treatment and allow faster quarantining of patients.

The posts on this blog are opinions, not advice. Please read our Disclaimers.

China: An Unlikely Stabilizer in Emerging Markets

Contributor Image
John Welling

Senior Director, Head of Global Equity Indices

S&P Dow Jones Indices

As investors grapple with the economic fallout of COVID-19 and seek to understand its impact, China has become an unexpected stabilizing force in emerging markets. Despite being the epicenter of the outbreak, Chinese equities have experienced lower volatility, minimal currency fluctuation, and less exposure to falling oil prices in the recent market environment in comparison with emerging market peers.

On Feb. 19, 2020, U.S. markets closed at their all-time high. The following days and weeks would see a precipitous drop in global markets, as the pandemic became the primary concern. By March 23, 2020, the S&P Emerging BMI had declined 31.9% to its recent low, in a matter of just over four weeks since signs of slowing started in the U.S. However, not all emerging regions fared equally, and China—the epicenter of the virus and the first to suffer the most drastic economic consequences—outperformed broader emerging markets by more than 20 percentage points in the first quarter (see Exhibit 1).

On the other hand, the S&P Emerging Ex-China BMI suffered the worst performance due to its lack of Chinese exposure, trailing the standard emerging benchmark by more than eight percentage points. In prior crises, emerging market benchmarks typically fared more negatively when compared with developed markets—something China exposure has mitigated in the current crisis.

Two of the largest companies in the S&P China BMI—Alibaba (down 11.5% in Q1) and Tencent (down 1.58% in Q1)—both contributed to the outperformance, as each amounts to an approximate 14.0% and 12.8% weight of the index, respectively.

Onshore Chinese Stocks Helped Hold Up the Performance

China A-shares, meanwhile, have been notoriously volatile throughout their history, whereas the performance of the S&P China A BMI nearly mimicked its broader counterpart. Recently added into the S&P Emerging BMI at a 25% partial inclusion rate, China A-shares—which account for a 7.0% weight in the S&P Emerging BMI—helped mitigate the emerging market slide.

Oil Exporters Hit, Currency Impact

While economists ponder whether China’s economy now has an advantage by having overcome the virus spread, its status as a non-oil-exporting nation seems to have helped. Even though the S&P China BMI fell 10.3%, oil-exporting countries Brazil and Russia plummeted 50.2% and 35.8%, respectively. In fact, China and Taiwan’s oil-importer status seems to have helped reduce some economic risk.

Next, we look at the currency impact on returns. We calculate the currency impact by looking at the difference between the USD index return and the local currency index return (see Exhibit 2). Negative figures in the last column indicate the impact of local currency depreciation relative to the U.S. dollar.

As the U.S. dollar strengthened sharply against most of those countries with the steepest equity losses, the Chinese yuan, Hong Kong dollar, and Taiwan dollar remained largely stable versus the USD. In particular, equity losses in South Africa, Mexico, Brazil, and Russia were exacerbated by extreme local currency weakness versus the U.S. dollar.

China Had Lower Volatility than Emerging Market Peers

In the last three months, the realized volatility[1] of the S&P China BMI remained largely below that of the S&P Emerging BMI, particularly as global markets began to price in the full effect of the economic impact. India, Russia, and particularly Brazil had significantly higher volatility during the first quarter.

COVID-19 has introduced a large amount of uncertainty into commodity and equity markets, and emerging countries have particularly suffered from the projected impacts. China, although at the epicenter of the crisis, has largely come out ahead of its emerging counterparts, with comparably lower drawdowns and volatility in Q1 2020.

[1] Realized volatility figures were calculated as the annualized standard deviation of 30-day rolling USD daily total returns between Nov. 29, 2019, and March 31, 2020.

The posts on this blog are opinions, not advice. Please read our Disclaimers.

Delivering Low Volatility Exposure to High Yield Bonds

Contributor Image
Hong Xie

Former Senior Director, Global Research & Design

S&P Dow Jones Indices

The last few weeks have been challenging for business the world over. People working from home and aggressive social distancing have led to business contraction and the expectation of rising default. On March 19, 2020, an S&P report expected that the U.S. trailing 12-month speculative-grade corporate default rate would rise to 10% within the next 12 months, from 3.1% in December 2019.

In this blog, we aim to highlight how the S&P U.S. High Yield Low Volatility Corporate Bond Index,[1] by reducing volatility, has delivered better risk-adjusted returns in recent market turmoil.

Option-Adjusted Spreads (OAS): Screaming Market Volatility

In 2020, high yield credit spreads traded stable at the tight end up until the first half of February, reflecting persistent yield chasing (see Exhibit 1). However, since then, global risk assets, driven by COVID-19 concerns, have sold off sharply. From Jan. 17, 2020, to March 23, 2020, the OAS for the S&P U.S. High Yield Corporate Bond Index widened by 719 bps from trough to peak, along with a 33% decline for the S&P 500® during the same time period.

S&P U.S. High Yield Low Volatility Corporate Bond Index: Lower Volatility, Better Long-Term Risk-Adjusted Returns

Exhibit 2 displays the comparative performance of the S&P U.S. High Yield Low Volatility Corporate Bond Index during the most stressed scenarios of the past two decades. There are two key takeaways.

  • The S&P U.S. High Yield Low Volatility Corporate Bond Index outperformed its broad market high yield benchmark during each of these stress periods, including a 2.8% outperformance during the recent COVID-19 sell-off; and
  • The defensive nature of the low volatility index has acted as cushion during market sell-offs.

Lastly, Exhibit 3 compares the return/risk trade-off among asset classes during 5-year, 10-year, and 20-year periods. There are several key points to be stressed.

  • The S&P U.S. High Yield Low Volatility Corporate Bond Index consistently exhibited volatility levels lower than its broad-based high yield benchmark;
  • In fact, its volatility levels fell between those of the investment-grade and high yield universes; and,
  • For longer time periods (20 years), the S&P U.S. High Yield Corporate Bond Index delivered higher marginal returns than its broad-based high yield benchmark for every incremental unit of risk to investment-grade bonds.

Conclusion

There remains a lot of uncertainty surrounding the current pandemic. It remains to be seen how soon economic activity could start to pick up. Therefore, we might be looking at an extended period of time with an evolving and uncertain economic situation. All of this uncertainty leads to volatility and even more so for risky assets such as traditional high yield bonds.

During times of uncertainty and volatility, the S&P U.S. High Yield Low Volatility Corporate Bond Index provides exposure to high yield bonds with reduced volatility and the potential for higher risk-adjusted returns in the long term.

[1]   For information about the methodology, please refer to https://spdji.com/documents/methodologies/methodology-sp-us-high-yield-corporate-bond-strategy-indices.pdf.

The posts on this blog are opinions, not advice. Please read our Disclaimers.

Volatile Start to 2020 - What's Next?

Contributor Image
Hamish Preston

Head of U.S. Equities

S&P Dow Jones Indices

Last year’s prognostications about the events and trends to monitor in 2020 have evaporated as COVID-19 has upended people’s lives and caused massive recalibrations in financial markets.  In Q1 2020, we said “goodbye to the bull market”; large market movements became the new normal; correlations and dispersion shifted drastically; quantitative easing returned; and access to liquidity was important for many, in both equity and fixed income markets.  Remarkably, all of this took place in little over a month. So much for 2020 foresight!

As COVID-19 dominated headlines, the S&P 500 finished with its worst quarterly total return (-19.60%) since Q4 2008’s 22% decline.  Matters would have been even worse had it not been for the S&P 500’s best 5-day total return since November 2008; the benchmark rose 17.4% between March 23 and March 30 to recover some of the prior losses.  [Through March 23, the S&P 500’s cumulative total returns since the start of the last bull market stood at the same level as in May 2017.]  Volatility goes both ways!

At a sector level, there was no place to hide to avoid declines in absolute terms in Q1: all S&P 500 sectors finished down for the quarter, only the seventh time this has happened since the end of 1989.  However, there was enormous value in identifying the relative winners or avoiding the relative losers: a whopping 38.5% separated the best performing sector in Q1 (Information Technology, -11.93%) and the clear laggard (Energy, down 50.45% amid oil prices plunges).  This quarterly difference was the highest since December 2001, and reflected a dramatic increase in stock and sector dispersion.

Across the market capitalization spectrum, the S&P 500 beat both the S&P MidCap 400 (-29.70%) and the S&P SmallCap 600 (-32.64%).  This may reflect expectations that larger companies may have stronger balance sheets and may be better able to weather the storm.

So what’s next?  Although the sea of red across dashboards makes for unpleasant reading, it is worth noting that first quarter declines don’t necessarily mean the rest of the year will be negative.  For example, the S&P 500 posted 31 negative first quarter total returns between 1937 and 2019.  In most cases (19), the benchmark posted a positive return over the next three quarters, including in 2009 when the S&P 500 fell more than 11% in the first three months before rising 42.11% over the last three quarters.

As a result, even though 2020 foresight has gone out of the window,  it may be worth staying the course instead of giving up on a possible recovery.

The posts on this blog are opinions, not advice. Please read our Disclaimers.