Get Indexology® Blog updates via email.

In This List

Oil Prices Plunge in Response to the Collapse of the OPEC+ Alliance

S&P Dow Jones Indices Launches First Single-Commodity Carbon Emission Allowances Index

The S&P Eurozone Paris-Aligned Climate Index Concept Sensitivity Analysis: Decarbonization over Time

Women and the S&P Latin America Emerging LargeMidCap ESG Index

The Irrelevance of Value in Low Volatility

Oil Prices Plunge in Response to the Collapse of the OPEC+ Alliance

Contributor Image
Fiona Boal

Managing Director, Global Head of Equities

S&P Dow Jones Indices

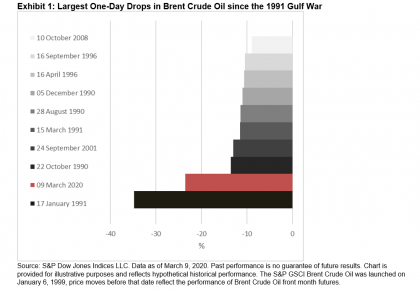
The S&P GSCI Brent Crude Oil has fallen by more than 30% over the first six trading days of March. On Friday, March 6, 2020, Russia opted out of a Saudi-led proposal to extend and deepen crude production cuts that had been central to a nearly three-year OPEC+ agreement to manage global oil supplies. With coronavirus cramping global oil demand, OPEC, led by Saudi Arabia, had wanted to further restrict supply to hold up oil prices.

Oil prices lost as much as a third of their value on Monday, March 9, 2020, the largest daily rout since the 1991 Gulf War. The S&P GSCI Brent Crude Oil ended the day down 23.5%. Exhibit 1 offers a visual representation of the this one-day price fall in the Brent crude oil prices.

The disintegration of the OPEC+ agreement almost immediately creates a new operating environment for the world’s three largest oil producers.

  1. Over the weekend, Saudi Arabia slashed the price of its crude oil by USD 6-USD 8 per barrel for all oil grades to all destinations, the largest single price cut in 30 years. It also signaled its intention to raise its oil production next month. While Saudi Arabia has the lowest cost of production, the largest amount of excess oil capacity, and can weather lower oil prices better than others, its economy and its social cohesion are highly dependent on strong oil prices.
  2. It would appear that Russia could no longer stomach that the OPEC+ production cuts were unintentionally favoring U.S. shale producers and likely limiting domestic energy investments. The Russian economy is more diversified than that of Saudi Arabia, and it is possible that Russia could also weather lower oil prices for some time.
  3. U.S. shale producers are the clear losers if this new low-price environment becomes the norm. Lower oil prices will quickly lead to acute financial stress and declining production from U.S. shale producers and other high-cost producers. U.S. crude oil exports could fall significantly.

It is also worth highlighting that the collapse of the OPEC+ agreement, and the anticipated increase in supply that it will bring, has been made against the backdrop of stymied global oil demand. While lower oil prices typically boost consumption, the global coronavirus outbreak is quashing oil demand and amplifying the effect of the anticipated supply surge. Falling demand has the potential to both deepen and lengthen the energy price rout. The most recent forecast from the International Energy Agency now has global oil demand contracting in 2020, which would mark the first year-over-year fall in demand in more than a decade.

Unless Saudi Arabia’s shock and awe tactics bring OPEC+ members, namely Russia, back to the negotiating table, the fight for oil market share has well and truly commenced.


The posts on this blog are opinions, not advice. Please read our Disclaimers.

S&P Dow Jones Indices Launches First Single-Commodity Carbon Emission Allowances Index

Contributor Image
Fiona Boal

Managing Director, Global Head of Equities

S&P Dow Jones Indices

The S&P GSCI Carbon Emission Allowances (EUA) EUR represents an expansion of the single-commodity series of indices based on the S&P GSCI and is the first index of its kind in the market. The S&P GSCI Carbon Emission Allowances (EUA) EUR is designed to provide investors with a reliable and publicly available investment performance benchmark for European Carbon Emission Allowances. The S&P GSCI Carbon Emission Allowances (EUA) EUR is based on the ICE EUA Futures Contract.[1]

Carbon emissions trading is a market-based method for reducing global greenhouse gases. Carbon trading in the EU was implemented as a result of the Kyoto Protocol—created by the United Nations Framework Convention on Climate Change (UNFCCC), aimed at fighting global warming. The objective was to develop a market that manages worldwide greenhouse gas emissions based on economic and trading principles that are common across commodities markets. This approach allows countries to reduce pollution with a cap and trade system that operates through regulated markets.

Emissions trading markets have become increasingly robust over recent years, offering a market-based approach to limiting pollution by providing economic incentives for achieving reductions in pollutant emissions. A liquid, transparent market for carbon and a robust price for carbon are critical to facilitating the reduction of greenhouse gas emissions. The S&P GSCI Carbon Emission Allowances (EUA) EUR seeks to offer access to the return stream of a unique asset that is uncorrelated to major commodities and other asset classes and, at the same time, may promote a transition to a lower carbon economy.

Investors may choose to utilize the carbon emissions trading market to express specific views on the price of carbon, to hedge or offset more carbon-heavy investments in their portfolio or combine carbon emissions with other assets to create energy-transition or low-carbon strategies.

There may also be opportunities for participants in the physical carbon emissions market to utilize financial products based on the S&P GSCI Carbon Emission Allowances (EUA) EUR in conjunction with other risk management instruments. Broadening the number of financial instruments available to hedgers in the global carbon market is an important goal of the S&P GSCI Carbon Emission Allowances (EUA) EUR.

[1] https://www.theice.com/products/197/EUA-Futures

The posts on this blog are opinions, not advice. Please read our Disclaimers.

The S&P Eurozone Paris-Aligned Climate Index Concept Sensitivity Analysis: Decarbonization over Time

Contributor Image
Ben Leale-Green

Former Associate Director, Research & Design, ESG Indices

S&P Dow Jones Indices

To meet the proposals for CTBs or PABs,[1]—as published by the EU Technical Expert Group (TEG) in its Final Report,[2] —active share[3] and therefore tracking error are uncertain over time,[4] due to the TEG’s absolute decarbonization proposal.[5] This blog assesses the S&P Eurozone Paris-Aligned Climate Index Concept’s (PAC Concept) potential active share sensitivity to future decarbonization, to align with a 1.5 °C scenario.[6] Exhibit 1 shows future PAB and CTB trajectories and possible parent index trajectories from 7% decarbonization and 3% carbonization. If in twenty years the parent index carbonizes at 3% year-on-year, a 90% relative carbon reduction will be required for the PAB (hopefully far higher than will be observed).

In January, S&P Dow Jones Indices released a paper for the PAC Concept—designed not only to meet the TEG’s proposals for PABs but incorporate transition risk, physical risk, and climate opportunities, as recommended by the TCFD7 (see Exhibit 2).

Baskets have been calculated using the methodology outlined,[8] with 50%-90%[9] decarbonization constraints. The aim is understanding how potential future relative carbon reductions, due to 7% year-on-year decarbonization, will affect diversification and active share of the PAC Concept.[10] The PAC Concept active share sensitivity analysis has been calculated with all other constraints held constant.[11]

Exhibit 3 shows the stock count and effective number of stocks[12] at each level of decarbonization. As decarbonization increases, the number of stocks decrease—this decrease in stock count is gradual until 90% decarbonization, which would be an extreme level of decarbonization. Furthermore, as stock count decreases, the effective number of stocks decreases at a slower rate—meaning the PAC Concept methodology allows concentration to increase at a slower rate than stock count decreases. Even at 90% decarbonization, which is very high, there is still reasonable diversification within the PAC Concept.

Exhibit 4 shows the sensitivity of active share as decarbonization increases. We can see a similar story as in Exhibit 3, where decarbonization up until 70% has a small impact on active share, and only when 90% decarbonization is targeted does active share jump.

Why is there a non-linear relationship between decarbonization and active share/effective number of stocks/stock count? Exhibit 5 shows the carbon intensity distribution for companies in the S&P Eurozone LargeMidCap, which have a heavy positive skew. This skew means decarbonization until a certain point does not require much active share. As decarbonization requirements increase, it takes more active share to meet the decarbonization constraint. When more significant weight can be taken out of high-emitting companies, this causes a large impact on the PAC Concept’s carbon footprint. However, as carbon reduction requirements grow, there is little or no weight to be taken from these highest-emitting companies, so weight must be taken from less carbon-intensive companies. This weight reduction in less carbon-intensive companies has a lower impact on the carbon footprint.

Overall, the PAC Concept appears to be able to decarbonize by an amount that is in line with a worst likely scenario, without causing drastically poorer diversification.

1 Regulation (EU) 2019/2089 has created two new categories of benchmark; Regulation (EU) 2019/2089 has created two new categories of benchmark; and the EU Climate-Transition Benchmark.

2 The EU Technical Expert Group on Sustainable Finance Final Report on Climate Benchmarks and Benchmarks’ ESG Disclosure, September 2019.

3 Active share measures how much of the parent index would have to be sold to invest in the PAC concept. ; where w is the weight of stock i.

4 Leale-Green, B. (2019, November). The EU Climate Transition and Paris-Aligned Benchmarks: A New Paradigm. Retrieved from Indexology Blog: https://www.indexologyblog.com/2019/11/07/the-euclimate-transition-and-paris-aligned-benchmarks-a-new-paradigm/

5 The final report published by the TEG proposes that CTBs and PABs decarbonize at 7% year-on-year, regardless of the parent index’s decarbonization. This means at any point in time, the relative carbon intensity reduction from the parent index is uncertain.

6 IPCC, 2018: Global warming of 1.5°C. An IPCC Special Report on the impacts of global warming of 1.5°C above pre-industrial levels and related global greenhouse gas emissions pathways, in the context of strengthening the global response to the threat of climate change, sustainable development, and efforts to eradicate poverty [V. Masson-Delmotte, P. Zhai, H. O. Pörtner, D. Roberts, J. Skea, P.R. Shukla, A. Pirani, W. Moufouma-Okia, C. Péan, R. Pidcock, S. Connors, J. B. R. Matthews, Y. Chen, X. Zhou, M. I. Gomis, E. Lonnoy, T. Maycock, M. Tignor, T. Waterfield (eds.)]. In Press.

7 TCFD. (2017). Final Report: Recommendations of the Taskforce on Climate Related Financial Disclosures.

8 Leale-Green, B., & Cabrer, L. (2020). Conceptualizing a Paris-Aligned Climate Index for the Eurozone. S&P Dow Jones Indices. Retrieved from https://spindices.com/documents/research/research-conceptualizing-a-paris-aligned-climate-index-for-the-eurozone.pdf

9 Analysis was performed on the S&P Eurozone LargeMidCap universe for a hypothetical rebalance in November 2019.

10 All other data has been held constant; in the future, other datasets in the PAC Concept will change, as will the parent index constituents and weights. Therefore, more or less active share may be required to hit the same levels of decarbonization in the future.

11 The constraints aim to meet the proposal for PABs and introduce transition risk, physical risk, and climate opportunities, as laid out by the TCFD.

12 The effective number of stocks (EN) is a measure of index concentration.  EN is calculated as: ; where w is the weight of stock i. The lower the value for EN, the more concentrated the index. The value for EN will fall between 1 and the number of stocks in the index (if the stocks are equally weighted).

The posts on this blog are opinions, not advice. Please read our Disclaimers.

Women and the S&P Latin America Emerging LargeMidCap ESG Index

Contributor Image
Maria Sanchez

Director, Sustainability Index Product Management, U.S. Equity Indices

S&P Dow Jones Indices

An opportunity is knocking at the door of companies in Latin America. S&P Global published the Corporate Sustainability Assessment (CSA) Latin America Progress Report 2019, which revealed that, on average, Latin American companies only have one female director on their board of directors.

Reviewing the 125 constituents of the S&P Latin America LargeMidCap as of Dec. 31, 2019, we obtained similar findings.

A recent study, When Women Lead, Firms Win, conducted by Daniel J. Sandberg, showed that firms with a high level of gender diversity on their board of directors have been more profitable than companies with a low level of gender diversity.

This result supports the inclusion of gender diversity as a relevant and important metric in CSA, an annual evaluation of companies’ sustainability practices in different dimensions. Gender diversity is evaluated through the Corporate Governance and Labor Practice Indicators outlined in the CSA.

S&P Dow Jones Indices uses S&P Global’s information to generate the S&P DJI ESG Scores, which focus on the most financially material and relevant ESG signals within specific industries. With these scores, S&P Dow Jones Indices designed the S&P ESG Index Series. This global series of indices provides improved ESG representation while offering a overall industry group weights similar to that of the respective benchmark.

One of the potential benefits of ESG indices is to have greater exposure to companies with above-average female representation on their board of directors. We found that the S&P Latin America Emerging LargeMidCap ESG Index has 18.7% more exposure to companies with at least 15% female representation on their boards, as compared with the S&P Latin America LargeMidCap (see Exhibit 2).

When it comes to the proportion of women holding management positions, the figures are even more striking. Only 5.5% of companies in the S&P Latin America LargeMidCap have more than 50% of management positions held by women. For the S&P Latin America Emerging LargeMidCap ESG Index, this number is 7.8%.

Out of 129[1] Latin American companies assessed through the CSA 2019 that reported their composition, 10.9% companies had more than 50% of women in management positions.

While the S&P Latin America Emerging LargeMidCap ESG Index shows increasing exposure to companies with female representation on their board of directors, the Latin American region has room to improve diversity further and, in doing so, potentially improve profitability.

[1]   53.52% of 241 companies assessed in the CSA 2019.

The posts on this blog are opinions, not advice. Please read our Disclaimers.

The Irrelevance of Value in Low Volatility

Contributor Image
Fei Mei Chan

Former Director, Core Product Management

S&P Dow Jones Indices

Low volatility strategies have achieved considerable market acceptance in the aftermath of the 2008 financial crisis.  For most of the 12 years since then, skeptics have argued that low vol might become, and sometimes that it has become, overvalued.  It’s an understandable concern, especially in light of the continuing popularity of low volatility strategies.

We recently updated our 2016 study of The Valuation of Low Volatility to see what, if any, impact valuations might have on the future performance of the S&P 500 Low Volatility Index®.  Our most important conclusion now, as it was then, is that valuations have little relevance as a leading indicator of Low Vol performance.

The chart below summarizes this point in one picture. It maps the monthly valuation of Low Vol (relative to the S&P 500) against its relative performance in the subsequent month. If it looks scattered, that’s because it is; the correlation between this month’s valuation and next month’s performance is 0.03.  As an indicator of entry and exit points for low volatility strategies, value does not appear to be valuable.

Scatter Plot of Monthly Relative Value Scores and S&P 500 Low Volatility Index Performance Spread in Subsequent Month Depicts No Relationship


The posts on this blog are opinions, not advice. Please read our Disclaimers.