Get Indexology® Blog updates via email.

In This List

Wash Your Hands of Market Timing with Risk Control

Rapid Reset

Federal Reserve Becomes Buyer of Last Resort

The SPIVA Latin America Scorecard Shows Diverging Countries

Coronaviral Correlations

Wash Your Hands of Market Timing with Risk Control

Contributor Image
Andrew Innes

Head of Global Research & Design

S&P Dow Jones Indices

The market highs of February 2020 already seem like a strange, distant past, in which people socialized, worked in offices, and were blissfully unappreciative of their abundant supply of toilet paper.

Life has changed. With that change, the S&P Europe 350® lost a third of its market capitalization in just a month. The market may have subsequently ticked up, but with volatility still high, it may be premature to call the bottom.

In times of market panic, it is not uncommon for defensive equity factor strategies to correlate with the market. They are, after all, still equity indices. However, the S&P DJI Risk Control Indices, which use realized market volatility to allocate systematically between an equity index and cash, were better able to cushion the crash.

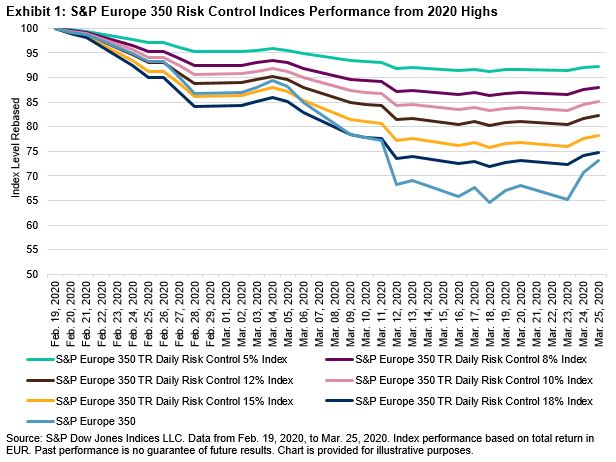
Exhibit 1 shows several risk control indices based on the S&P Europe 350. Each index targets a specific level of annual volatility (e.g., 5%, 8%, 10%, 12%, 15%, or 18%) by reducing its equity allocation when volatility is higher than this target and increasing it when it is lower. Recently, in keeping with current advice, they stayed calm and carried on (from home).

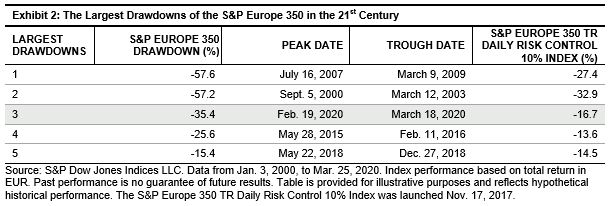
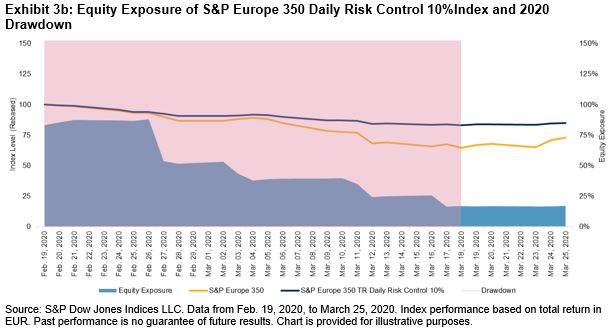
The S&P DJI Risk Control Indices are designed to hold a higher allocation to cash during periods of heightened volatility, and the recent outperformance is typical of the historical record during drawdowns for the benchmark [see Exhibit 2].

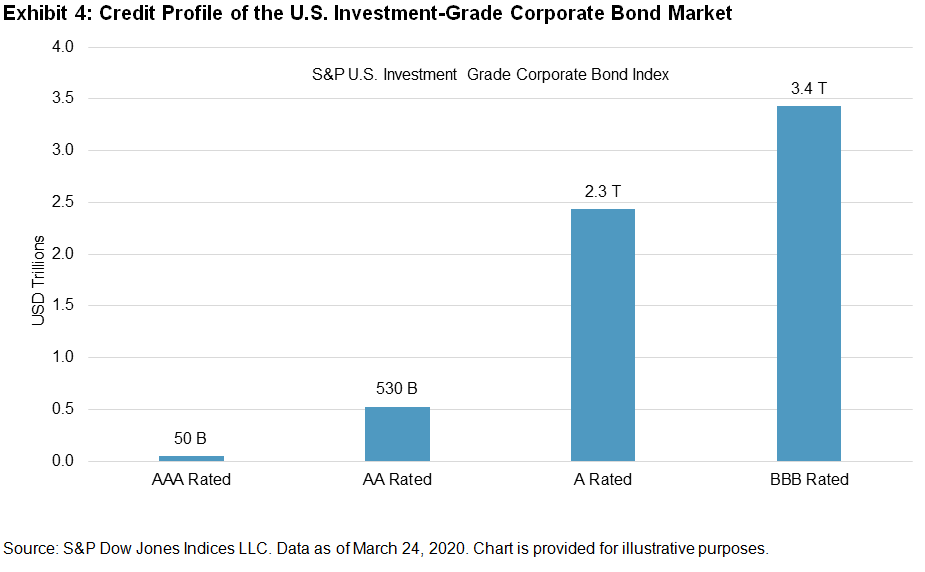
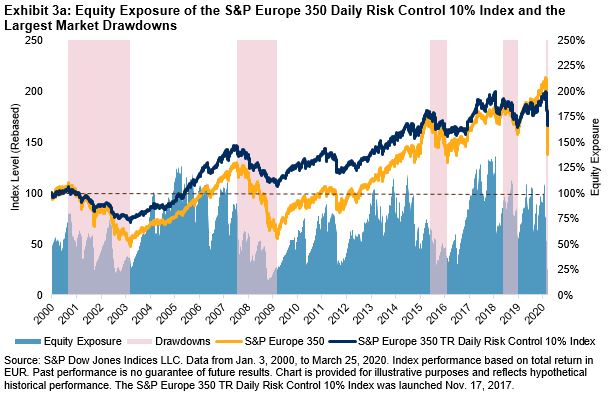
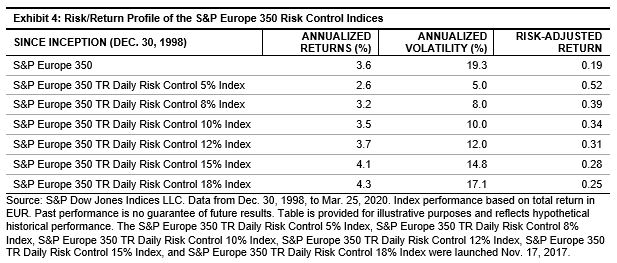
Additionally, when volatility is below target, the S&P DJI Risk Control Indices can allocate more than 100% to equities [see Exhibit 3a], so that the indices can occasionally participate more fully in market gains. This combination of drawdown protection and market participation has historically led to better performance for a given level of risk than the S&P Europe 350 over the long term [see Exhibit 4].

The S&P DJI Risk Control Indices provide an alternative, long-term solution that requires no subjective input or activity from the investor. If volatility stays high and markets continue to fall, risk control indices will continue to outperform. Should markets begin their recovery and volatility decline, risk control indices will eventually reallocate back to equities. Additionally, the target volatility mechanism will be there, ready to react again in the future.

Maybe a hands-off approach is what many of us should be looking for after all.

The posts on this blog are opinions, not advice. Please read our Disclaimers.

Rapid Reset

Contributor Image
Jim Wiederhold

Former Director, Commodities and Real Assets

S&P Dow Jones Indices

Over the past decade, we witnessed the longest economic expansion in history. During that time, risk appetite spiked, elevated largely by deflated interest rates around the globe in the wake of the Global Financial Crisis, as accommodative monetary policy lifted many investors up the risk curve. As in previous crisis periods, elevated risk asset valuations could not hold; today, those levels face the sobering reality of a global pandemic, which has driven global equities into a bear market and threatens to cause a global recession. This drop was different than others before it, however, as it took only a month for stock prices to fall from all-time highs to a deep trough, making it the fastest decline into bear market territory for many major equity benchmarks in history. Investors are now struggling through a rapid reset, looking for the bottom while curtailing their risk appetite.

Though some market pundits repeatedly predicted the collapse of the stock market over the past decade only to be proven wrong time and again with each new market high, during the 2010s, we witnessed one of the least-volatile eras in modern financial markets.

There was one asset class that remained volatile during the past 10 years, however. Commodity market volatility has nearly always been more elevated than that of equities markets, and for good reason: commodities are not anticipatory assets, and spot prices largely reflect the current physical supply and demand dynamics of each underlying commodity. Exhibit 1 highlights that difference in volatility; of particular note is the volatility over the longer term, where the S&P GSCI and S&P GSCI Gold were clearly more volatile than equities or fixed income.

So far in 2020, volatility has spiked across nearly all asset classes. If this holds, these levels would be at least double anything we’ve seen over the past 10 years. While volatility for commodities has jumped this year, due to movements in the oil market, U.S. equity and real asset volatilities ticked up even more in the panic.

Though there has already been a seismic shift in broader risk sentiment across all asset classes, within the commodities market, we may see additional risk re-evaluation. In general, there has been a supply glut across the board for many years, which has depressed price levels. While the primary focus since the start of the COVID-19 pandemic has been on the scale and longevity of demand destruction, supply disruptions will increasingly become a factor in price discovery. Companies involved in the production of commodities are pulling back in response to government-enforced shutdowns and collapsing prices. This is most apparent in the U.S. energy space, where cutbacks in new projects will start to affect oil supply by the end of 2020. The S&P GSCI Petroleum is down a staggering 58.3% YTD, reflecting these depressed price levels, and it is not yet pricing in a supply shortfall. Forced shutdowns are not only affecting the energy sector but metals and mining companies as well. While current stockpiles may meet immediate demand in the short run, once global supply chains start moving again, there will likely be a short- to medium-term drag on supply while firms in many commodities markets restart their operations.

Are we finally at a moment of peak commodities supply? It is impossible to say for certain in the face of an unpredictable pandemic and unprecedented monetary and fiscal stimulus. However, global commodities supply has and will likely continue to fall in the near term, and as levels of economic activity start to pick up, supply will play an increasingly important role in the price discovery process.

The posts on this blog are opinions, not advice. Please read our Disclaimers.

Federal Reserve Becomes Buyer of Last Resort

Contributor Image
Jason Giordano

Director, Fixed Income, Product Management

S&P Dow Jones Indices

In a previous blog, we discussed the U.S. Federal Reserve’s initial responses to the current market volatility and resultant dislocations. In short, dropping rates to 0% and adding over USD 1 trillion to the funding markets did little to abate the severity of the situation. In an effort to prevent a liquidity crisis from turning into a solvency crisis, the Federal Open Market Committee (FOMC), in combination with the Department of Treasury, has rolled out the following measures.

  1. Quantitative Easing (QE): QE is back and bigger than ever: The FOMC will purchase at least USD 500 billion of Treasury securities and at least USD 200 billion of mortgage-backed securities.

There’s no telling exactly what this amount could climb to, given that the objective is to purchase “amounts needed to support smooth market functioning and effective transmission of monetary policy to broader financial conditions and the economy.”1 Exhibit 1 shows the securities held on the Fed’s balance sheet since 2008 through prior QE phases and the 17-month period of quantitative tightening that began in 2017. The red line shows the rapid expansion taking place the week of March 23.

  1. Term Asset-Backed Securities Loan Facility (TALF): USD 10 billion funded by the Department of Treasury.

Another tool from the GFC, the TALF will “enable the issuance of asset-backed securities (ABS) backed by student loans, auto loans, credit card loans, loans guaranteed by the Small Business Administration(SBA), and certain other assets.”1 Exhibit 2 shows the current composition of the asset-backed securities market and its growth following the GFC.

  1. Expansions to the Money Market Mutual Fund Liquidity Facility (MMLF) and the Commercial Paper Funding Facility (CPFF): In an effort to facilitate the flow of credit to municipalities, the Federal Reserve is expanding the MMLF and the CPFF to include high-quality, tax-exempt issues as eligible securities.

This will have a greater impact on money markets than on municipalities, as state and local governments will most likely require more direct intervention. However, Exhibit 3 shows that the announcement encouraged some price support in the broad municipal bond market.

  1. Establishment of Two New Facilities: In an effort to support credit to large employers, the FOMC established the Primary Market Corporate Credit Facility (PMCCF) for new bond and loan issuance and the Secondary Market Corporate Credit Facility (SMCCF) to provide liquidity for outstanding corporate bonds; each facility will begin with USD 10 billion funded by the Department of the Treasury.

This is, perhaps, the most drastic measure the FOMC is taking in an effort to support funding for large corporations. The PMCCF will allow investment-grade companies access to credit and will provide bridge financing of four years. The SMCCF will purchase corporate bonds in the secondary market issued by investment-grade U.S. companies and U.S.-listed exchange-traded funds whose investment objective is to “provide broad exposure to the market for U.S. investment-grade corporate bonds.”1

The FOMC is prohibited from selecting specific corporate issuers, and they can only purchase bonds with a rating of BBB- or higher. Exhibit 4 shows the current credit profile of the U.S. investment-grade corporate bond market. Of the USD 6.3 trillion of corporate bonds, more than 55% are rated BBB. While both facilities will surely grow in size to support the market need, the greater risk is the further degradation of credit quality of the USD 3.4 trillion of corporate bonds outstanding.

While the measures outlined in this post are intended to provide support to corporate and municipal debt markets, monetary policy (no matter how extreme) may not be enough to prevent further repricing. More than likely, the highly anticipated fiscal response is what will ultimately determine how soon stability returns to financial markets.

  1. Board of Governors of the Federal Reserve System; federalreserve.gov.

The posts on this blog are opinions, not advice. Please read our Disclaimers.

The SPIVA Latin America Scorecard Shows Diverging Countries

Contributor Image
Maria Sanchez

Director, Sustainability Index Product Management, U.S. Equity Indices

S&P Dow Jones Indices

The SPIVA® Latin America Year-End 2019 Scorecard was released last week, showing divergent results for Latin American equities markets. The report covers Brazil, Chile, and Mexico in selected fund categories. In the framework of stable inflation, a decline in unemployment, and lower interest rates, 2019 was a great year for Brazilian equities markets, as measured by its benchmarks across three fund categories; the S&P Brazil BMI returned 35%, the S&P Brazil LargeCap returned 26%, and the S&P Brazil MidSmallCap returned 55%. Compared with Brazil, Mexico’s equities market was positive, but with moderate results; the S&P/BMV IRT increased 2%. The case of Chile was much more unfortunate, especially considering the recent social unrest, with the S&P Chile BMI falling 8.8% during the 12-month period ending on Dec. 31, 2019.

The rise in the Brazilian equities markets lead to active large-cap fund managers’ outperformance against the S&P Brazil LargeCap during the one- and three-year periods, although they couldn’t repeat the performance for longer-term periods. Mexican active equities fund managers and Chilean active equities fund managers failed to beat their benchmarks over the one-, three-, five-, and ten-year periods (see Exhibit 2). Mexican funds led survivorship across the four observation periods.

For more details on the SPIVA Latin America Year-End 2019 Scorecard, please click here.

The posts on this blog are opinions, not advice. Please read our Disclaimers.

Coronaviral Correlations

Contributor Image
Craig Lazzara

Former Managing Director, Index Investment Strategy

S&P Dow Jones Indices

Mea culpa: Roughly a month ago I used a dispersion-correlation map to describe how index dynamics can illuminate market movements.  In particular, I reported that since high dispersion seems to be a necessary condition for a bear market, and S&P 500 dispersion levels at the end of February were far below those prevailing in past declines, conditions at that time did not look like bear markets had historically looked.  Since our analysis uses a 21 trading day lookback, I providentially noted that “in 21 more days we’ll have a completely new set of observations.”

21 days have now passed, and we have a completely new set of observations.  Market dynamics have evolved with extraordinary speed, as any sentient observer knows.  Exhibit 1 shows the decline in the S&P 500 since its February 19th high, plotted against comparable data from the 2007-09 financial crisis.  The index declined 32% from its peak through the close of trading on March 20, 2020.  The comparable loss of value during the financial crisis required a full year.

Exhibit 1.  Current Decline vs. Financial Crisis

Source: S&P Dow Jones Indices. Data from Oct. 9, 2007 (blue) and Feb. 19, 2020 (orange). Graph is provided for illustrative purposes. Past performance is no guarantee of future results.

Just as values deteriorated rapidly, dispersion and correlation shifted rapidly.  Exhibit 2 plots 21-day trailing dispersion and correlation between February 19 and March 20.  The movement toward higher dispersion and higher correlation – upward and to the right – is striking.  Bear markets seem less dependent on correlation than on dispersion, and dispersion has increased dramatically.  But what’s particularly striking is today’s elevated levels of correlation.

Exhibit 2.  Evolution of Dispersion and Correlation Since the Market Peak

Source: S&P Dow Jones Indices. Data from Feb. 19, 2020 to March 20,2020. Graph is provided for illustrative purposes.

This makes fundamental economic sense, of course, since correlation measures the degree to which the components of the index move together.  A pandemic of still-unknown duration and severity can be expected to affect every business adversely.  The degree of adversity will obviously vary across industries, with some (e.g., airlines and hotels) suffering more than others (which accounts for heightened dispersion).  But almost all will move down, driving correlations higher.

Exhibit 3 makes it clear that this has happened to an unprecedented degree, as correlations within the S&P 500 reached record levels for the month ended March 20.  Students of index dynamics will not be surprised: high volatility can be expected when both dispersion and correlation are elevated.  It is hard, in fact, to find other months comparable to this one; Exhibit 3 highlights those closest to today in the upper right corner.

Exhibit 3.  Dispersion and Correlation by Month

Source: S&P Dow Jones Indices. Data from Jan. 31, 1971 through March 20, 2020. Graph is provided for illustrative purposes only.

Exhibit 4 identifies each month in which dispersion was above average and correlation was elevated (above 0.45), and asks what happened in the aftermath of the market’s reaching those levels.  There have been 11 such months since 1971; in every case the market was higher a year later, with an average gain of 24%.

Exhibit 4.  The Aftermath of High Volatility

Source: S&P Dow Jones Indices. Chart is provided for illustrative purposes only. Past performance is no guarantee of future results.

Past results legendarily do not predict future returns, and today’s correlation levels suggest that more spikes in volatility might lie ahead.  But selling stocks in environments like the present has historically meant missing out on the recovery.

The posts on this blog are opinions, not advice. Please read our Disclaimers.