Get Indexology® Blog updates via email.

In This List

Why Risk Control Works

Why Might Actively Managed Bond Funds Underperform their Benchmarks?

The Rieger Report: 2015 Headwinds & Tailwinds for Municipal Bonds

The Rieger Report: Municipal Bonds and the Taxman

U.S. Preferred Stock: Equity & Bond Characteristics Helping or Hurting Performance?

Why Risk Control Works

Contributor Image
Tianyin Cheng

Former Senior Director, ESG Indices

S&P Dow Jones Indices

Recently, institutional investors with long-term investment horizons have responded with aversion to market volatility by considering a number of risk control strategies.  Risk control strategies use dynamic asset allocation (between an index and cash) to target a stable level of volatility in all market environments.  For institutional investors with long-standing liabilities, ranging from defined benefit plans and variable annuities offered at insurance companies, a risk control strategy may provide a smoother path of asset returns and could more closely align the performance of the institution’s assets to the characteristics of its liabilities.

The basic idea is that the investor sets a target volatility, which is then matched by allocating funds to the risky asset and the risk-free money market.  If the realized historical volatility is above the target, money is shifted to cash.  On the other hand, if the realized historical volatility is below the target, leverage is taken in order to achieve the target.

This strategy takes advantage of the negative relationship between volatility and return, as well as the persistence of volatility.  As illustrated in Exhibit 1, the monthly volatility of the S&P 500® is negatively correlated with its monthly returns.  This relationship is present in most equity indices.  As a result, a strategy that reduces exposure in periods when volatility is high and increases exposure in periods when volatility is low would be more likely to outperform in risk-adjusted terms over the long run.

In addition, the S&P 500 daily returns are not independent across time, as large returns tend to be followed by large returns and small returns tend to be followed by small returns.  In Exhibit 2, the sample autocorrelation function shows significant autocorrelation in the squared residual series, calculated by the square of daily total return of the S&P 500 subtracted by the long-term average daily return.  This illustrates that periods of high and low volatility tend to cluster together for extended periods of time.  Therefore, a risk-control strategy based on realized historical volatility is likely to add value over the long run as well; even though we do not forecast volatility.

Capture

Capture

The posts on this blog are opinions, not advice. Please read our Disclaimers.

Why Might Actively Managed Bond Funds Underperform their Benchmarks?

Contributor Image
J.R. Rieger

Former Head of Fixed Income Indices

S&P Dow Jones Indices

Over the long term, actively managed bond funds have not outperformed their benchmarks  as evident in the SPIVA U.S. Scorecard for year-end 2014.  In a recent blog post, I analyzed the performance data of this scorecard.  Many wonder what might be causing the results to be one-sided.  For example, in a recent post on Practical Stock Investing, the author states that “the numbers are stunning” but questions what the reason is for this  “woeful showing.”   Here  are some possible explanations of why actively managed bond funds might underperform their benchmark:

  • Interest rate call. Sounds easy but it isn’t and getting the timing right is equally as critical.
  • Duration risk. A component of the right interest rate call is managing duration risk.  What is the funds duration target?  How will it achieve that target and when?
  • Sector allocation.  For multi-asset class funds and corporate bond funds, sector weights can make a difference.  When to reallocate and place more/less weight in select sectors?
  • Credit selection. A more pressing issue for corporate bond funds includes which credits should the fund invest in, how much to invest in them and when to do so?
  • Turnover & transaction costs.  Indices do not take into account the costs of transactions. Turnover in a fund translates into transaction costs, the higher the turnover, the higher the ‘friction’ or erosion on returns.
  • Timing.  Timing is mentioned in almost all of these possible explanations.

There may be other explanations but these are the ones that I believe have the most impact.

The posts on this blog are opinions, not advice. Please read our Disclaimers.

The Rieger Report: 2015 Headwinds & Tailwinds for Municipal Bonds

Contributor Image
J.R. Rieger

Former Head of Fixed Income Indices

S&P Dow Jones Indices

As we near the end of the first quarter, investment grade tax-exempt bonds tracked in the S&P National AMT-Free Municipal Bond Index have returned 0.93% year-to-date underperforming relative to the over 2% return of the investment grade corporate bond market tracked in the S&P U.S. Investment Grade Corporate Bond Index.

High yield bonds are showing similar results.  The S&P Municipal Bond High Yield Index has returned 1.23% year-to-date while the S&P U.S. High Yield Corporate Bond Index has returned 2.48%.

What is going on?  The reality is that there are both headwinds and tailwinds buffeting the municipal bond market.

First, some potential headwinds for municipal bonds for the rest of 2015:

  • Retail Sentiment: The municipal bond market is heavily driven by retail investor sentiment.  If ‘mom and pop’ don’t like municipal bonds then fund flows will most likely be negative.  The more negative headlines the more likely that retail sentiment turns negative.
  • Puerto Rico:  This is an ugly and complex situation that is likely to lead to some massive defaults of Puerto Rico revenue bonds.  So far, the S&P Municipal Bond Puerto Rico Index has dropped 1.34% in March eroding the previous two months of positive performance.   State bond funds with Puerto Rico bond exposure are impacted on two fronts 1) bond prices falling and 2) possible lack of liquidity when and if they decide to sell the bonds.  The uninsured bonds are included in the S&P Municipal Bond High Yield Index and the recent drop in bond prices is helping to weigh the high yield segment down.  There are no  Puerto Rico bonds in the S&P National AMT-Free Municipal Bond Index.
  • Illinois and New Jersey:  Each of these states has pretty large pension short falls to negotiate and this may result in headline after headline of bad press.
  • Chicago: Is Chicago is the next Detroit? I don’t think so.  However, how the Windy City deals with its budget and obligations is most likely going to be closely watched again creating headlines.
  • Rising Interest Rates: Bonds are bonds, if yields rise bond prices go down.

Some potential tailwinds for municipal bonds in 2015 include:

  • High quality: The investment grade municipal bonds tracked in the S&P National AMT-Free Municipal Bond Index are incrementally higher quality than their corporate counterparts.  Please refer to Should Municipal Bonds Be Considered Core? for more detail.
  • Supply and demand: 
    • No tax relief in sight:  Demand for tax-exempt bonds is in large part driven by the current tax environment.
    • New issue supply:  Demand still outpaces supply. While new issues have been increasing, the volume is partly driven by refunding bonds replacing higher yielding bond issues.
  • Diversification:  There are tens of thousands of municipal bond issuers from small local municipalities to states and territories.  The vast majority are investment grade.  There are over 10,000 bonds tracked in the S&P National AMT-Free Municipal Bond Index and all are investment grade.
  • Comparative yield with less duration risk: Relative to other investment grade fixed income asset classes, investment grade municipal bonds still provide comparative yield when viewed from the Taxable Equivalent Yield perspective.  Using a 35% tax rate the Taxable Equivalent Yield of the S&P National AMT-Free Municipal Bond Index is 2.91% while the yield of taxable bonds in the S&P U.S. Investment Grade Corporate Bond Index is 2.81%.  Meanwhile, the duration of the bonds in the S&P National AMT-Free Municipal Bond Index is 4.7 years nearly two years shorter than its corporate bond index counterpart.
  • Value in the ‘belly of the curve’:  On a nominal yield basis a diversified basket of non-callable investment grade bonds tracked in the S&P AMT-Free Municipal Series 2020 Index (5 year bonds) have a higher yield than the 5 year U.S. Treasury bond.  The same is true for the S&P AMT-Free Municipal Series 2024 index  (9 year bonds) verses the 10 year U.S. Treasury bond yield.   Note: S&P Dow Jones Indices has not yet launched the index tracking non-callable bonds in 2025.

And then there is the Tobacco Settlement bond sector.

  • Tobacco Settlement bonds:  This sector has a split personality – it is both a short term positive return driver and a long term hazard. So far in 2015 tobacco settlement bonds have returned over 3.7% as tracked by the S&P Municipal Bond Tobacco Index.  Recent successful refunding bond issues have certainly helped and no defaults are imminent but the long term future is clouded (I have called it a “dark cloud on the horizon”) as these bonds are dependent upon U.S. sales revenue of tobacco products.  The long duration of bonds in this sector also make it prone to dramatic price changes when yields change.  Tobacco settlement bonds are excluded from the S&P National AMT-Free Municipal Bond Index.

The posts on this blog are opinions, not advice. Please read our Disclaimers.

The Rieger Report: Municipal Bonds and the Taxman

Contributor Image
J.R. Rieger

Former Head of Fixed Income Indices

S&P Dow Jones Indices

The tax season for U.S. taxpayers is upon us.  For bond income what you keep after Uncle Sam takes his share can be more important than what you earn.

Income, Yield and Duration:

  • Investment grade municipal bonds on average have a higher coupon cash flow to bondholders than corporate bonds and that cash flow is exempt from federal taxation.  The average tax-exempt coupon of investment grade bonds in the S&P National AMT-Free Municipal Bond Index is 4.61% while the average taxable coupon of bonds in the S&P U.S. Investment Grade Corporate Bond Index is 4.31%.
  • Tax-exempt municipal bonds have a lower yield than corporate bonds. If a municipal bond and a corporate bond had the same coupon, maturity, quality and other characteristics the municipal bond would have a higher price and lower yield than the corporate bond.  The tax-exempt yield of bonds in the S&P National AMT-Free Municipal Bond Index is 1.88% and corporate bonds in the S&P U.S. Investment Grade Corporate Bond Index are yielding 2.81%.  One yield is representing a tax-free yield (not subject to federal taxes) and the other, the corporate yield, is before taxes are applied to the income.  Another way to look at this would be to put each on an equal footing by using the taxable equivalent yield for municipal bonds.  The taxable equivalent yield of the bonds in the S&P National AMT-Free Municipal Bond Index is 2.89% (assuming a 35% tax rate).  In other words, to find equivalent taxable bonds one would need to find bonds that yield at least 2.89% or higher to keep the same amount of return after taxes.  The higher the tax rate the higher the taxable equivalent yield.   A 40% tax rate shifts the taxable equivalent yield of municipal bonds to over 3.1%.
  • Here is the kicker:  the yield comparison above is unfair to municipal bonds as investment grade municipal bonds on average have a shorter duration than their corporate counterparts.  As we continue to be on the edge of a rising interest rate environment duration remains a key consideration.  The modified duration of bonds in the S&P National AMT-Free Municipal Bond Index is 4.7 years while corporate bonds tracked in the S&P U.S. Investment Grade Corporate Bond Index have a duration of over 6.5 years.  Based on this, corporate bonds should experience more volatility to the down side than municipal bonds if and when rates rise.

The bottom line: A focus on yield is important but it is actually what we get to keep after taxes that helps keep tax-exempt municipal bonds showing their value in this market.

The posts on this blog are opinions, not advice. Please read our Disclaimers.

U.S. Preferred Stock: Equity & Bond Characteristics Helping or Hurting Performance?

Contributor Image
J.R. Rieger

Former Head of Fixed Income Indices

S&P Dow Jones Indices

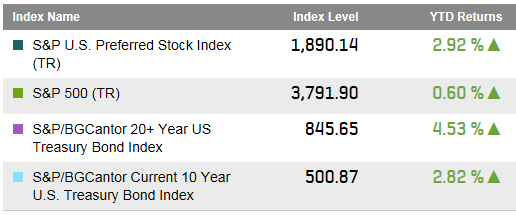
In this prolonged low interest rate environment, the S&P U.S. Preferred Stock Index has performed well, returning 2.92% year-to-date.   Meanwhile, the S&P 500 (TR) is up a modest 0.6% and long term bonds tracked in the S&P/BGCantor 20+ Year U.S. Treasury Bond Index are up 4.53% in total return.  So far, the preferred stock market with characteristics of both equities and bonds has performed as expected – somewhere in the middle of the performance of stocks and long term bonds.

Select Indices: Year to Date Performance (March 27, 2015):

Source: S&P Dow Jones Indices LLC.  Data as of March 27, 2015.
Source: S&P Dow Jones Indices LLC. Data as of March 27, 2015.

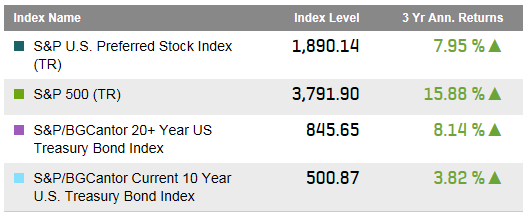
Over a three year period, the annualized returns of the U.S. preferred market have been more bond like than equity like.  The S&P U.S. Preferred Stock Index had a three year annualized return of 7.95% while long U.S. Treasury bonds have returned 8.14%.  Meanwhile, the three year annualized return of the S&P 500 has been well over 15%.

Select Indices: Three Year Performance (March 27, 2015):

Source: S&P Dow Jones Indices, LLC.  Data as of March 27, 2015.
Source: S&P Dow Jones Indices, LLC. Data as of March 27, 2015.

While it is easy to relate the performance of preferred stock and long term bonds to interest rate changes, the two asset classes have shown a low correlation to each other over the last three years.  Actually, the S&P U.S. Preferred Stock Index has had a higher correlation to the S&P 500 than it did to long term to bonds.  There is a danger in just looking at the last three years of course as interest rates have been held low during the period.

Three Year Correlations:

Source: S&P Dow Jones Indices, LLC.  Data as of March 27, 2015.
Source: S&P Dow Jones Indices, LLC. Data as of March 27, 2015.

Will a rising interest rate environment bring the same pain to preferred stocks as it might to long term bonds?  The short term history illustrates that the combined equity and bond like characteristics of preferred stock both play a role in actual performance.  Like all things still to come, we will just have to wait and see how the markets unfold.

The posts on this blog are opinions, not advice. Please read our Disclaimers.