Get Indexology® Blog updates via email.

In This List

2019: A Market Review

Raising the Bar in Canadian Small Caps

Common Confusion

Unlikely Tariff Rollback Deflated Commodities in November

Stock Pickers: Hope Springs Eternal

2019: A Market Review

Contributor Image
Hamish Preston

Head of U.S. Equities

S&P Dow Jones Indices

With 2019 coming to a close, market participants may use the time to evaluate portfolio performance and to assess what changes (if any) they would like to make based on return expectations and the market outlook.  While the future is uncertain – hindsight really will be 2020 when it comes to evaluating next year’s returns – 2019’s market movements can provide context for where we are and where we may be headed.

2019 has been positive for U.S. equities

In contrast to the gloomy market outlooks to start the year, 2019 has been almost entirely positive for U.S. equities.  The S&P 500 has posted 26 all-time high closing price levels and currently boasts a 27.4% year-to-date total return, while the S&P MidCap 400 (+22.89%) and the S&P SmallCap 600 (+19.90%) have also gained.  More broadly, 42 of the 45 style and sector indices based on the S&P 500, S&P 400, and S&P 600 have risen so far in 2019:  smaller energy companies and small-cap communication services stand as the exceptions.

The Fed, trade tensions, and earnings have driven sentiment so far this year

Despite the broad-based gains in U.S. equities, there have been a few bumps along the way as expectations over future Fed policy, U.S.-China trade tensions, and corporate earnings have taken it in turns to drive sentiment.

For example, better-than-expected corporate earnings, easing trade tensions, and signs of economic growth initially helped the S&P 500 to its best total return through the end of April since 1987, up 18.3%.  But the market was gripped by a case of “he said, Xi said” in May: comments from President Trump and President Xi raised the prospects of tit-for-tat tariffs and led the S&P 500 to a 6.4% monthly decline.

Over the summer, Jerome Powell’s comments that the Fed would “act as appropriate to sustain the expansion” heralded a return to bad news is good news.  Underwhelming economic data fueled expectations for future rate cuts, which in turn were expected to have a positive impact on equities.  This supported the S&P 500 during its best June performance since 1955 – its 7.1% monthly gain also coincided with optimism that trade tensions would ease after the U.S. and China met at the June’s G20 summit.

More recently, the market put its disappointment about July’s “mid-cycle adjustment” in the rear-view mirror:  the S&P 500 recorded 6 consecutive weekly gains as the market got the rate cuts it expected, earnings largely beat expectations, and trade tensions eased.

2020 to be a stock-pickers market? Maybe not

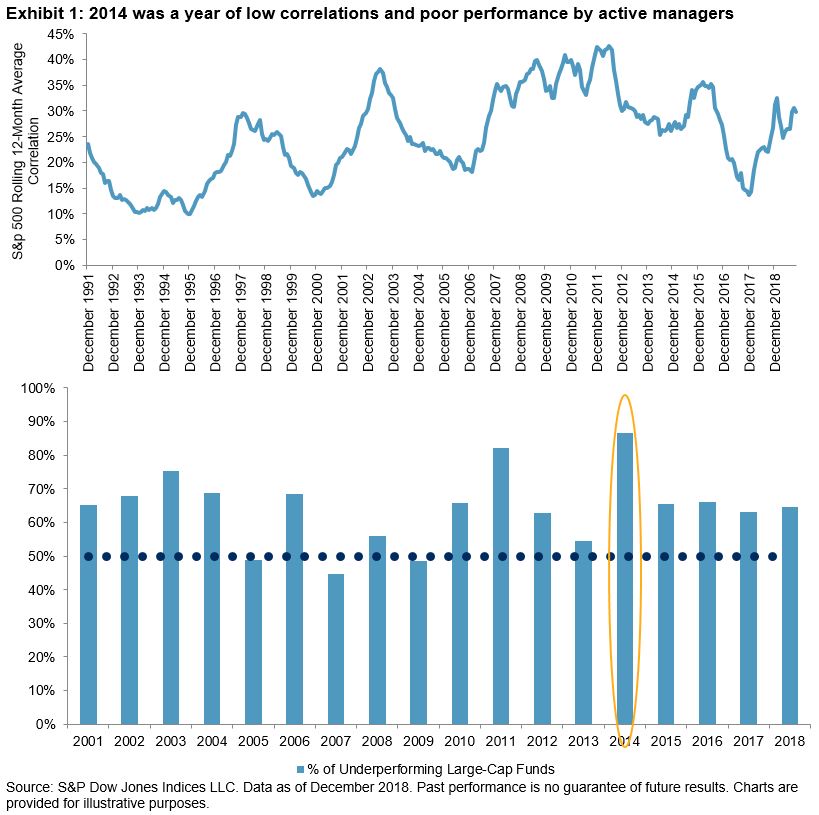
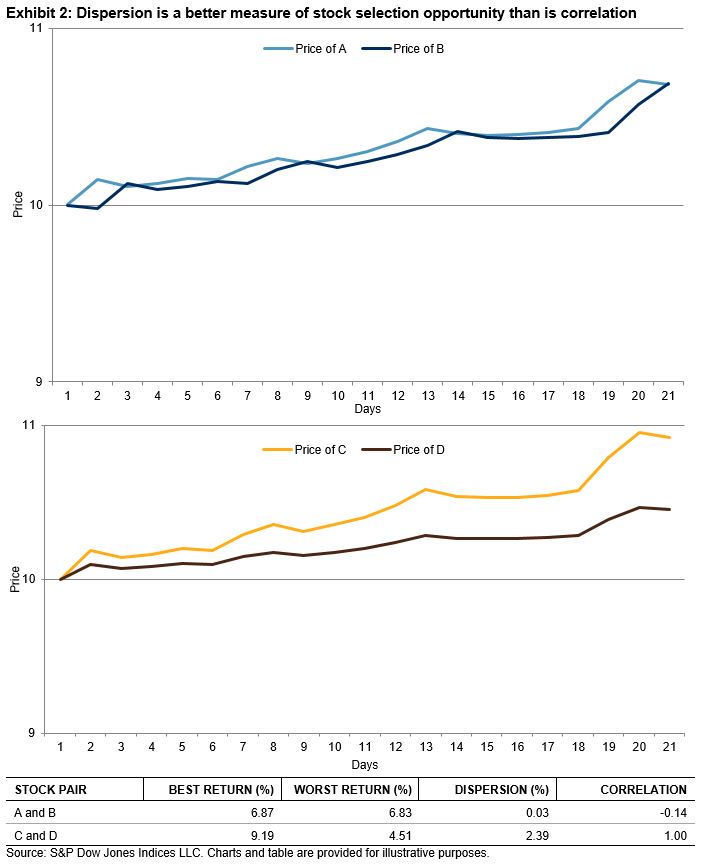
The idiosyncratic reactions of companies to the various drivers of recent market returns has contributed to a decline in correlations.  Some have argued that this means 2020 will be the year of the stock-picker, but this argument is not new: hope springs eternal for active managers.

As we have shown before, a better measure of active management’s alpha opportunity is dispersion:  a greater proportion of large-cap active managers typically underperformed the S&P 500 when dispersion was lower.  Given U.S. large-cap dispersion has remained subdued so far this year, the current environment may pose challenges for many large-cap active managers.

Thank you, Jack Bogle!

Finally, no review of 2019 would be complete without a mention of one of the titans of indexing, John C. Bogle, who died in January.  In the words of Warren Buffett:

“If a statue is ever erected to honor the person who has done the most for American investors, the hands-down choice should be Jack Bogle”.

The posts on this blog are opinions, not advice. Please read our Disclaimers.

Raising the Bar in Canadian Small Caps

Contributor Image
Michael Orzano

Head of Global Exchanges Product Management

S&P Dow Jones Indices

Prior research has demonstrated that profitability matters for small-cap companies in the U.S. and in global equity markets. For example, the S&P SmallCap 600®—which includes an earnings eligibility criteria—has outperformed the broader Russell 2000 Index (with lower volatility) over its 25-year track record.

Our new S&P/TSX SmallCap Select Index extends this phenomenon to Canadian equities, where we have found that a similar effect exists. Simply put, filtering out the “junk” makes a big difference in Canadian small caps. Exhibit 1 illustrates the total return improvement and volatility reduction of the S&P/TSX SmallCap Select Index versus the broader S&P/TSX SmallCap Index over the past 15 years.

How Does the S&P/TSX SmallCap Select Index work?

The index follows the same methodology framework as our existing S&P SmallCap Select Index Series, but uses the S&P/TSX SmallCap Index as its selection universe. In order to be eligible for index inclusion, companies must post two consecutive years of positive earnings per share. As a buffer, companies are dropped from the index after posting two consecutive years of negative earnings. In order to improve replicability of the index, we also eliminate the 20% smallest and 20% least liquid companies. The index is weighted by float market cap and is rebalanced semiannually in June and December.

As of the June 2019 index rebalancing, the S&P/TSX SmallCap Select Index included 100 of the 199 companies in the S&P/TSX SmallCap Index and captured about 65% of the float market cap of the benchmark index. As shown in Exhibit 3, the majority of the exclusions were driven by the positive earnings requirement.

To learn more about the impact of including a positive earnings requirement in Canadian small caps, please see our recently published short paper that introduces the S&P/TSX SmallCap Select Index.

The posts on this blog are opinions, not advice. Please read our Disclaimers.

Common Confusion

Contributor Image
Craig Lazzara

Former Managing Director, Index Investment Strategy

S&P Dow Jones Indices

The critics of passive investing are nothing if not creative.  One of their objections to the growth of index funds stems from the putative problem of “common ownership.”  The argument is that index funds’ ownership of many of the competitors in most industries encourages or facilitates collusive behavior.  “[T]he fear is that by owning chunks of many companies in a sector…investors are influencing them to act in ways that maximize gains for all. That is opposed to pushing individual companies to compete more vigorously with rivals and undercut one another on price.”

Many of the fronts in the counterattack against indexing are manned largely by active investment managers; this one, in contrast, seems to be mainly the province of academics, and especially of law professors, some of whom think that index fund ownership of much of corporate America violates anti-trust law.  Probably the most often-cited example of the putative common ownership effect is an academic claim that U.S. airline ticket prices are “10% to 12% higher because of common ownership.”  No one, interestingly enough, claims that index funds explicitly encourage corporate managements to fix prices; rather, index managers supposedly don’t encourage vigorous competition.  “Doing nothing, that is, not pushing portfolio firms to compete aggressively against each other” supposedly produces anti-competitive results because corporate managements know that their shareholders are also owners of their competitors.  “Softer competition” is simply a result of the nature of every corporation’s shareholder registry.

It’s not hard to understand why professors like this argument so much: it’s clever and reflects a basic understanding of industrial structure.  Monopolies are more profitable than competitive markets.  However, making the argument that index funds are the likely driver of monopolistic behavior requires us to believe in two additional propositions:

  1. The sum of the profits of competing firms will be higher if they share a monopoly than if they compete against one another aggressively.
  2. Some shareholders, including (but not limited to) index funds, own shares in more than one competitor, and may therefore be happy with their proportional share in a monopoly.

The problem is that proposition 1 does not depend on proposition 2.  Having a share of a monopoly may be more profitable than competing actively, for both shareholders and firms, even if there is no overlap in ownership.  If there are competitive issues in some industries, index funds can’t be fairly blamed for producing them.

The posts on this blog are opinions, not advice. Please read our Disclaimers.

Unlikely Tariff Rollback Deflated Commodities in November

Contributor Image
Fiona Boal

Managing Director, Global Head of Equities

S&P Dow Jones Indices

The broad commodities were tepid in November. The S&P GSCI was flat for the month and up 9.9% YTD. The Dow Jones Commodity Index (DJCI) was down 2.1% in November and up 4.5% YTD. Gains were driven by the energy complex, while both precious metals and industrial metals detracted from headline performance.

The S&P GSCI Petroleum was up 2.0% in November. Oil prices were poised to end the month near two-month highs on expectations of an extension of OPEC+ production cuts, but on the last trading day of the month prices fell by over 4% due to fresh concerns over U.S.-China trade talks and a record high U.S. crude output of 12.5mm barrels per day. OPEC and Russia are likely to extend existing production cuts by another three months to mid-2020 when they meet in early December. In the physical oil market, traders are paying near-record premiums for sweeter crude barrels, as new marine fuel regulations from the start of 2020 have encouraged refiners to use crude oil grades that produce less high-sulphur fuel oil.

The S&P GSCI Nickel was in freefall in November, down 18.1%, with the largest move by far within the industrial metals space. This was due to the market focusing attention on current subpar demand, even with Indonesia cutting back exports. Prices for stainless steel, of which nickel is a component, have continued to decline due to record inventories. With a technical drop in support of its 200-day moving average and market participants’ bullish positions exited, the environment was ripe for a big move lower. In spite of these conditions, the S&P GSCI Nickel was still up 29.5% YTD and was one of the better-performing commodities overall. The S&P GSCI Lead and the S&P GSCI Zinc fell about 10% and 8% respectively, while the S&P GSCI Iron Ore rose 7.71% after falling 5.9% the prior month.

The S&P GSCI Gold lost some of its luster in November, down 3.1% on the back of an overall better risk sentiment, with equity markets continuing to post new all-time highs and VIX® near multi-month lows. However, gold’s loss was palladium’s gain. The S&P GSCI Palladium continued to add to its impressive YTD performance, reaching another new high on the last day of the month to close November up 3.4% and up 55.55% YTD.

The S&P GSCI Agriculture was down marginally in November. As harvest in the U.S. comes to an end, both the corn and soybean markets have continued to be weighed down by the protracted U.S.-China trade talks and plentiful domestic supplies. Improving weather for planting in Brazil and Argentina also added pressure to the markets. The S&P GSCI Coffee ended the month up 13.4%; Arabica coffee supplies have  tightened from recent record levels, with a global deficit now forecast for the 2019-2020 season, an off-year for top producer Brazil’s biennial crop cycle. Certified stocks on the Intercontinental Exchange (ICE) also fell to their lowest level in nearly 18 months.

It was another mixed bag for the livestock sector in November; the S&P GSCI Lean Hogs was down 11.0%, while the S&P GSCI Live Cattle rose 2.8%. Despite the fact that the U.S. sold more pork this year to international buyers than ever before, the S&P GSCI Lean Hogs was down 22.9% YTD, reflecting a significant increase in pork supply. U.S. pork production is on a record pace for 2019.

The posts on this blog are opinions, not advice. Please read our Disclaimers.

Stock Pickers: Hope Springs Eternal

Contributor Image
Anu Ganti

U.S. Head of Index Investment Strategy

S&P Dow Jones Indices

The Wall Street Journal recently quoted several active managers who claim that “conditions for stock picking are improving”. Their rationale is that declining correlations among stocks in the S&P 500 have made it easier for active managers to select stocks based on fundamental analysis.

We have heard this argument before, most notably in 2014 when, as Exhibit 1 demonstrates, correlations had fallen substantially from their financial crisis peak. But 2014 was also a year of record underperformance by active managers, as our SPIVA scorecards demonstrate. As we have argued previously, this is because dispersion, not correlation is the appropriate metric with which to measure the prospective success of stock pickers.

Correlation is a vital tool in analyzing portfolio diversification, but it is dispersion, or cross-sectional portfolio volatility, that offers a more meaningful way to identify opportunities for active management.  Exhibit 2 offers a simple illustration that demonstrates this point:

Compare stock pairs A and B versus C and D. Both pairs have an average return of 6.85%, but it’s obvious that an active manager who can choose between C and D can add more value than her competitor who chooses between A and B. And yet – the correlation of A and B is negative, while the correlation of C and D is 1.0. Dispersion, not correlation, determines the value added potential of active managers.

The posts on this blog are opinions, not advice. Please read our Disclaimers.