The Wall Street Journal recently reported that, according to analysis by Credit Suisse, the correlation among S&P 500 sectors had fallen close to its lowest level ever, and that this was good for active equity managers, “who find it easier to make money betting on specific companies or trends when stocks aren’t all moving together.” There’s some validity to these points, but the full story is more complex.
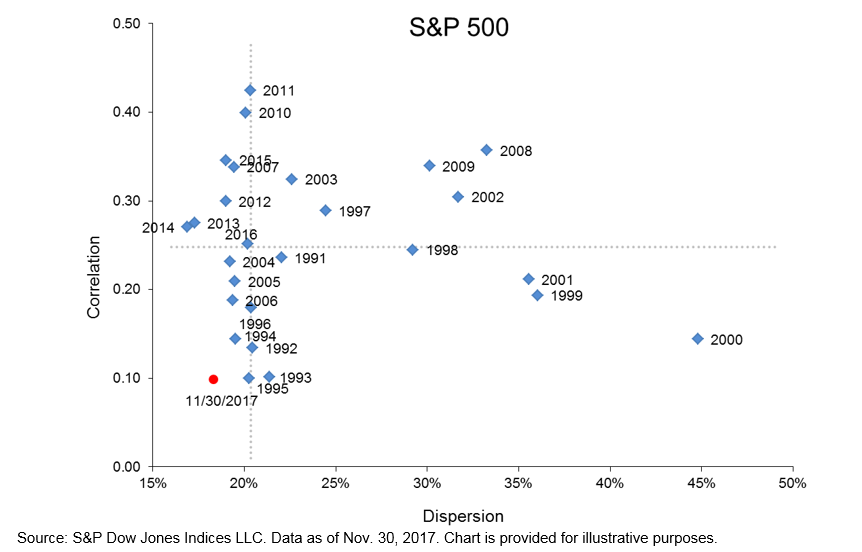
First, if you want to measure correlation in the S&P 500®, you should do it at the level of individual securities, not across the index’s 11 sectors. Inter-sectoral correlation tells us something about the benefit of diversifying across sectors, but it’s also indifferent to the securities within each sector. An active stock picker presumably doesn’t share this indifference. The good news is that, measured at the stock level, correlations are still quite low. Calculated properly, we find that the correlation of the S&P 500 as of Nov. 30, 2017 was an extremely low 0.10.
More importantly, for active managers correlation is not the whole story, nor even the most important part of the story. Dispersion, or cross-sectional portfolio volatility, offers a more meaningful way to identify opportunities for active management.
The dispersion of the S&P 500 as of Nov. 30, 2017 was 18.3%, moderately low by historical standards, per the below dispersion-correlation map:
In contrast, dispersion is typically higher for small-cap stocks than large caps. Dispersion for the S&P SmallCap 600® spiked in November to an eye-popping 46.1%. Value added opportunities for skillful stock selection among small caps are therefore much larger than in the large-cap universe.
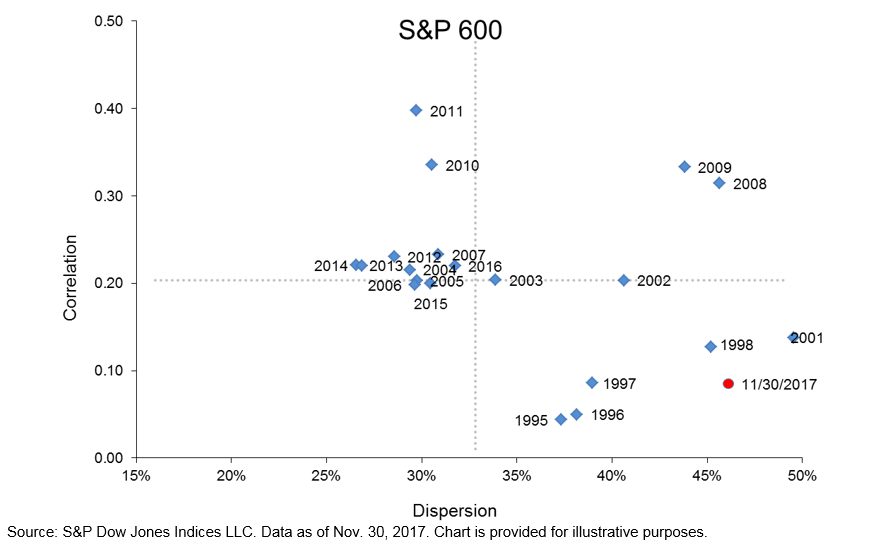
While correlations are indeed low, we caution that it is premature to rejoice and declare a “stock-pickers’ market,” particularly for large caps, until S&P 500 dispersion starts to move higher.
The posts on this blog are opinions, not advice. Please read our Disclaimers.