Get Indexology® Blog updates via email.

In This List

Sorry, Wrong Number

Can indexes help organizations manage the financial risk of healthcare costs?

Your Core Portfolio

An Overview of India’s Market Today: Looking at S&P BSE Indices

Islamic Index Market Update: August 2014

Sorry, Wrong Number

Contributor Image
Craig Lazzara

Former Managing Director, Index Investment Strategy

S&P Dow Jones Indices

Last week brought yet another indication that 2014 is proving to be a very difficult environment for active stock selection strategies.  With the majority of large cap U.S. equity managers underperforming the S&P 500, “only performances in 2006, 2010 and 2011 have been as bad or worse than the current year’s pace.”

Well, in any series with variation, some years will be better than average and some will be worse, and to readers of our SPIVA reports it’s hardly a secret that most active managers fail most of the time.  But what seems particularly troubling to some commentators in 2014 is that the underperformance of active managers has occurred in the face of below-average correlations in most equity markets.  Indeed, earlier this year a number of market analysts opined that 2014 would witness the long-awaited “stock-picker’s market,” providing respite to fundamental managers whose performance had been beleaguered by years of indiscriminately-high correlations.

The prediction that correlations would decline was correct.  But if you’re interested in gauging the potential success of active stock selection strategies, correlation is the wrong number to predict.  Here’s a simple illustration of why:

A and B part 2

C and D

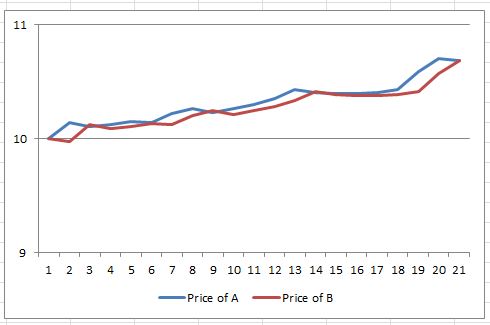
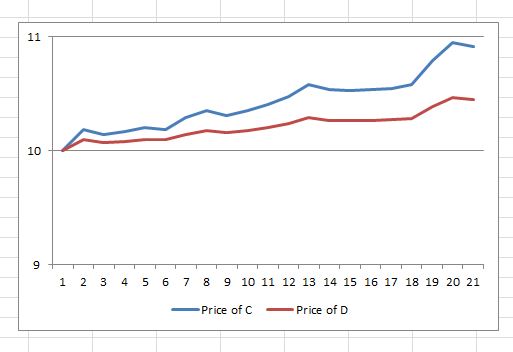
Where would active stock picking be more profitable: in choosing between A and B, or between C and D?  Each pair averaged a return of 6.85%, but the graphs make obvious that the correct choice between C and D was worth a lot, despite their perfect correlation.  And the difference between A and B was de minimis, despite their negative correlation:

ABCD summary

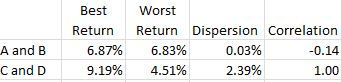
Late last year we introduced the concept of dispersion as a measure of market opportunity.  Our simple example illustrates, as we’ve argued before, that dispersion is a better measure of stock selection opportunity than is correlation.  And, unfortunately for the advocates of active management, dispersion remains at historically low levels.  Regardless of how correlations change, the opportunities for active stock pickers will languish until dispersion rises.

The posts on this blog are opinions, not advice. Please read our Disclaimers.

Can indexes help organizations manage the financial risk of healthcare costs?

Contributor Image
Michael Taggart

Consultant, S&P Healthcare Indices

S&P Dow Jones Indices

Moving past the political debate around Obamacare, the news last month drove home a more important point – not only are healthcare costs high and increasing, but the rate at which these costs increase (trend) is also volatile. Walgreens made headlines when it announced that FY 2016 pharmacy earnings would drop by over $1.1 billion dollars. The fact that an organization with the healthcare expertise and resources of Walgreens can miss earnings by over a billion dollars shows how difficult the problem of managing healthcare cost trends can be. This problem is compounded because unlike many other industries, the healthcare industry has very few tools available for managing the financial risk of cost trends.

From the outset, the S&P Healthcare Claims Indices have been designed to support financial hedging tools that could allow organizations exposed to future healthcare cost trends to manage that risk. By providing a broad range of indices that track the key measures of healthcare cost trends (such as drug costs, hospital costs, regional trends and insurance plan trends), the indices can be tailored to allow organizations to track the specific cost trends that are critical to their own situation. In cases such as Walgreens, the ability to hedge exposure to the impact of future price changes in generic/brand drugs (or changes in utilization) could have provided a solution to the inherent risk of volatile trends. Although the S&P Healthcare Claims Indices have only been available since October 2013, some organizations such as health insurance carriers and employers are already beginning to look to the indices as a way to hedge financial exposure. The application of index based risk management tools to healthcare financing is an exciting development and could be a critical component in bringing healthcare costs under control.

The posts on this blog are opinions, not advice. Please read our Disclaimers.

Your Core Portfolio

Contributor Image
Daniel Gamba

Managing Director

BlackRock

In my post on ETFs in the Core in May, I mentioned that the goal of most investors is to manage risk, seek income, and achieve long-term growth. These goals, of course, need to be built on a solid foundation: the “core” of a portfolio. The idea of the core is to establish the right mix of exposures and investments, at an attractive price point, that seek to drive value over the long term.

With over 5,000 ETFs to choose from, building your core with ETFs does require a framework. Institutional investors have extensive due diligence processes for selecting investment products and in many cases, a whole staff to do the work. Based on my extensive work with institutions I propose using a simplified approach when selecting ETFs for the core of your portfolio.  Here are the five key questions you should be asking:

1.     Provider – How well do you know your provider?
Consider both the ETF provider’s experience in the ETF market, as well as the provider’s size, scale, track record and level of commitment to the ETF industry and to managing exposures versus  a rule or an index.  Different ETF providers have different investment philosophies. Importantly, your ETF provider should offer value add services, including a user-friendly web site with tools to help you build your core. For example, iShares utilizes the interactive Core Builder tool to help investors navigate possible ways to achieve this objective.

2.     Exposure – Can you get the exposure you want?
ETFs, even within a particular asset class or segment of the market, can vary significantly. Pay attention to the index and ask your financial advisor questions about differences between products and its ability to track a core index or benchmark. Understand the exposure you want and ensure the ETF you select is capturing that.

3.     Structure – Are there risk & cost implications from the ETF structure?
Look for ETFs whose product design balances desired exposure with cost and tax efficiency, as well as liquidity. In general, the ETF structure can help minimize the unintended tax consequences.  Generally speaking, ETFs tend to have lower turnover relative to actively managed funds, which can help minimize annual capital gains taxes.

4.     Liquidity – Can you trade when you need to?
Because ETFs trade on exchange, liquidity is a huge factor in why many investors utilize them.  Even for core holdings, which are by definition more long-term in nature, you still want to ensure you have the ability to trade when it’s time to dial up or down your exposure. However, be sure to examine the liquidity of the ETF itself, as well as liquidity of underlying securities.  

5.     Costs – What is the total cost of ownership?
Expense ratios are important, however all implicit costs including trading and market impact, should be factored in. Your financial advisor can help you estimate the impact of your trade before it’s placed.

———————————————————————————————————————————

Capital Gains Taxes: A type of tax levied on capital gains incurred by individuals and corporations. Capital gains are the profits that an investor realizes when he or she sells the capital asset for a price that is higher than the purchase price. Capital gains taxes are only triggered when an asset is realized, not while it is held by an investor. An investor can own shares that appreciate every year, but the investor does not incur a capital gains tax on the shares until they are sold.
Carefully consider the Funds’ investment objectives, risk factors, and charges and expenses before investing. This and other information can be found in the Funds’ prospectuses or, if available, the summary prospectuses which may be obtained by visiting www.iShares.com or www.blackrock.com. Read the prospectus carefully before investing.
Investing involves risk, including possible loss of principal.
The Funds are distributed by BlackRock Investments, LLC (together with its affiliates, “BlackRock”).
The strategies discussed are strictly for illustrative and educational purposes and should not be construed as a recommendation to purchase or sell, or an offer to sell or a solicitation of an offer to buy any security. There is no guarantee that any strategies discussed will be effective. The information provided is not intended to be a complete analysis of every material fact respecting any strategy. The examples presented do not take into consideration commissions, tax implications or other transactions costs, which may significantly affect the economic consequences of a given strategy. Diversification and asset allocation may not protect against market risk.
There can be no assurance that an active trading market for shares of an ETF will develop or be maintained.
©2014 BlackRock. All rights reserved. iSHARES and BLACKROCK are registered trademarks of BlackRock. All other marks are the property of their respective owners. iS-12782.

The posts on this blog are opinions, not advice. Please read our Disclaimers.

An Overview of India’s Market Today: Looking at S&P BSE Indices

Contributor Image
Utkarsh Agrawal

Associate Director, Global Research & Design

S&P Dow Jones Indices

The stock markets in India have performed phenomenally in the recent months.  The S&P BSE SENSEX (India’s most tracked bellwether index) has been scaling heights never seen before.  The one-year, risk-adjusted return of the index was approximately 3.53 as of August 29, 2014.  With 30 stocks, the index is well diversified across sectors.  It will be intriguing to explore the performance of the sectors with the help of S&P BSE sector indices for the one-, three-, five- and seven-year time periods ending on August 29, 2014.  All the sector indices are subsets of the S&P BSE 500, and they cover approximately 90% of the market capitalization of the respective sectors in the index, giving a good idea of each sector’s performance.

In all the observed time periods, the S&P BSE AUTO has consistently yielded higher risk-adjusted returns than the S&P BSE SENSEX.

The S&P BSE BANKEX only provided risk-adjusted returns close to those of the S&P BSE SENSEX in the seven-year time period, and it remains lower than S&P BSE SENSEX for all the time periods.

Compared with the S&P BSE SENSEX, the S&P BSE CAPITAL GOODS delivered less than 25% of risk-adjusted returns in the three-, five- and seven-year time periods, and it came close to S&P BSE SENSEX in the one-year time period.

The S&P BSE CONSUMER DURABLES provided risk-adjusted returns greater than those of the S&P BSE SENSEX only for the three-year time period.

Except for the one-year time period, the S&P BSE FMCG provided higher risk-adjusted returns than the S&P BSE SENSEX over all the other observed periods.  The S&P BSE FMCG has the most stable risk-adjusted return profile.

The S&P BSE HEALTHCARE also provided higher risk-adjusted returns than the S&P BSE SENSEX for all the time periods except for the one-year period.

The S&P BSE IT provided higher risk-adjusted returns than the S&P BSE SENSEX in all the time periods except for the one-year time period as well.

In the three-, five- and seven-year time periods, the S&P BSE METAL delivered less than 15% of risk-adjusted returns compared with the S&P BSE SENSEX.  The S&P BSE METAL remains lower than S&P BSE SENSEX for all the time periods.

Compared with the S&P BSE SENSEX, the S&P BSE OIL & GAS has given less than 55% of risk-adjusted returns in all the time periods.

The S&P BSE POWER has been hit the hardest with negative risk-adjusted returns in the three-, five- and seven-year time periods, and it remains lower than S&P BSE SENSEX for all the time periods.

The S&P BSE REALTY has also had negative risk-adjusted returns in the five- and seven-year time periods, and it remains lower than the S&P BSE SENSEX for all the time periods.

For all except the one-year time period, the S&P BSE TECK has had a risk-adjusted return profile close to that of the S&P BSE SENSEX.   The S&P BSE TECK returned almost half of the S&P BSE SENSEX in the one-year time period.

Sector Table

*S&P BSE CAPITAL GOODS; **S&P BSE CONSUMER DURABLES

Source: Asia Index Pvt. Ltd. Data as of last trading date of August 2014. Risk adjusted return has been calculated for total return indices. This chart may reflect hypothetical historical data. Please see the Performance Disclosures for information regarding the inherent limitations associated with back tested data.  Past performance is no guarantee of future results.


The posts on this blog are opinions, not advice. Please read our Disclaimers.

Islamic Index Market Update: August 2014

Contributor Image
Michael Orzano

Head of Global Exchanges Product Management

S&P Dow Jones Indices

Islamic Indices Outperforming Conventional Benchmarks in 2014
Shariah-compliant benchmarks have outperformed conventional indices in 2014 as Financials – which are underrepresented in Islamic indices – have experienced some weakness, and Information Technology, Health Care and Energy – which tend to be overweight in Islamic Indices – have been sector leaders.

Capture

Through August 27, 2014, the Dow Jones Islamic Market World Index gained 7.3%, while the Dow Jones Global Index gained a comparatively modest 6.0%. The effect has been particularly strong in Asia where the DJIM Asia Pacific Index has gained 9.0% year-to-date, while the Dow Jones Asia Pacific has gained just 6.0%. Key U.S and Middle-Eastern Islamic benchmarks likewise experienced similar outperformance.

Capture
Asia Pacific and Emerging Markets Rebound After Weakness in 2013
Regional markets that fared poorly in 2013 – notably Asia Pacific and Emerging Markets – have generally rebounded and outperformed so far in 2014. Following a decline of 0.3% in 2013, the DJIM Asia Pacific Index gained 10.7% through August 27. Likewise, the DJIM Emerging Markets Index was up 10.4% over this period, following a loss of 2.2% in 2013.

GCC Markets Power Higher Despite Volatility
Middle-Eastern equity markets have been highly volatile in 2014, but have continued to power higher. The S&P U.A.E Shariah and S&P Qatar Shariah have gained 40% and 52%, respectively year-to-date through August 27 despite seeing sharp temporary drops in excess of 20% in June. Saudi Arabia has also seen strong performance in 2014 as enthusiasm over the expected relaxation of foreign investment restrictions has buoyed the country’s equity market. Through August 27, the S&P Saudi Arabia Shariah Index was up 6.5% for the month and nearly 25% year-to-date in USD terms driving a nearly 25% year-to-date increase in the S&P GCC Composite Shariah.

The posts on this blog are opinions, not advice. Please read our Disclaimers.