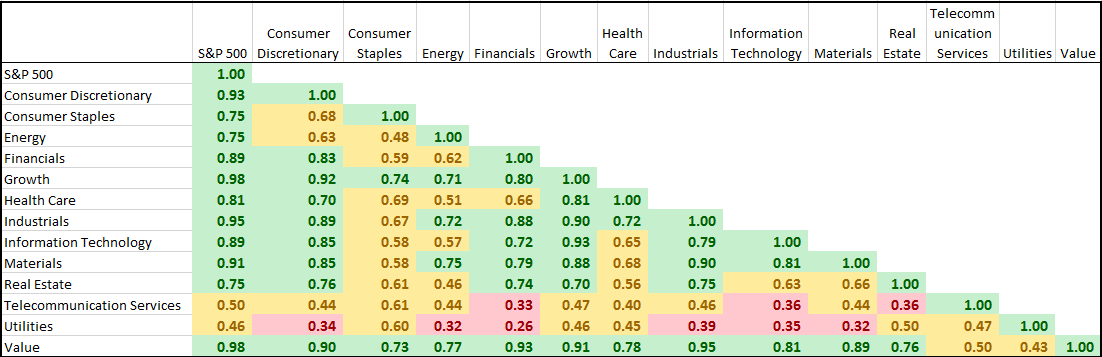
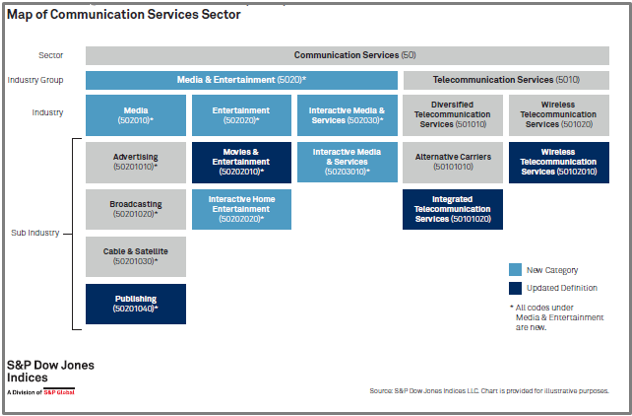
In part 1 of this post, the current sector weights, returns and correlations of the S&P 500 are shown, as well as a map depicting the expanded telecommunication services sector into communication services. Now, here’s a deeper dive into what is moving and its impact.
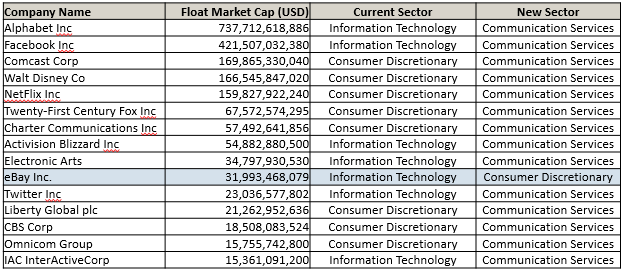
While the entire list of companies moving can be found on our website, below are the top 15 companies by size with a total market cap of about $2 trillion that are moving sectors, primarily into telecommunications services that will be renamed communication services. Roughly $1.24 trillion is moving out of information technology and $620 billion is moving out of consumer discretionary. Also note eBay is moving from information technology into consumer discretionary. Another point of interest may be that the former FAANG group of Facebook, Apple, Amazon, Netflix and Alphabet’s Google, largely followed as “tech” stocks will be dispersed so that only Apple will be in information technology, while Amazon remains in consumer discretionary, and Facebook, Alphabet and Netflix will move to communication services. Other notable moves from consumer discretionary are Comcast and Disney.
In the S&P Total Market Index (TMI), a total of 137 stocks are moving into communication services with 48 leaving information technology and 89 from consumer discretionary. In the S&P 500, 23 stocks are entering communication services while 8 are leaving information technology and 15 are leaving consumer discretionary.

This will bring communication services to be the 5th biggest sector of 11 in the S&P 500 at 10% weight with information technology losing over 5% and consumer discretionary losing about 2.5%. The 3 sectors combined will have approximately $10 trillion in market cap, and will account for just over 40% of the S&P 500.

Alphabet, Facebook, TripAdvisor and Twitter are the major companies in the biggest sub-industry group that will total 46% of the $2.5 trillion communication services sector. The integrated telecommunication services sub-industry will make up 19% with AT&T and Verizon. Movies & Entertainment moving from consumer discretionary are nearly the same portion of communication services as the telecom sub-industry, with a 17% weight from Netflix, 21st Century Fox, Viacom and Disney. Also worth mentioning are the major companies, Charter, Comcast and DISH in the cable & satellite sub-industry.

The results of the GICS reclassification change the characteristics of the sectors impacted but mainly change the style of telecommunication services from value to growth. Prior to the change, the S&P 500 telecommunication services sector was 100% value but shifts to a mix of about 2/3 growth and 1/3 value with the additional stocks in communication services. Also, the P/E almost triples from 7.7 to 21 and price to book nearly doubles from 1.9 to 3.9, while the beta increases from 0.73 to 1.06. The dividend yield also drops from 6% to 1.1%. These changes may alter the way investors use the sector depending on their goals.
Using hypothetical back-tested data, the 10 year annualized price returns of the communication services sector is 15.8% and outperforms the telecommunication services sector by 12.29%. However, both the hypothetical back-tested consumer discretionary and information technology sectors slightly underperformed the actual sector structures over 10 years. The annualized price returns over 10 years of the hypothetical back-tested consumer discretionary sector was 19.3% and information technology was 19.1%, a respective 14 and 61 fewer basis points than the actual sector performance.

Further, the hypothetical backtested communication services sector outperformed the current telecommunication services sector by 12.39% on average per calendar year, while the hypothetical consumer discretionary and information technology sectors underperformed the current structures by -0.13% and -0.57%, respectively, on average per calendar year.

While the hypothetical backtests should be used with caution since the market today is different than it was ten years ago, it is worth analyzing to understand some hypothetical characteristic differences.
For more information, please visit our website or contact index_services@spglobal.com.
This was written by product management and based only on publicly announced data and not a product of GICS, IMPG or Index Governance.
The posts on this blog are opinions, not advice. Please read our Disclaimers.