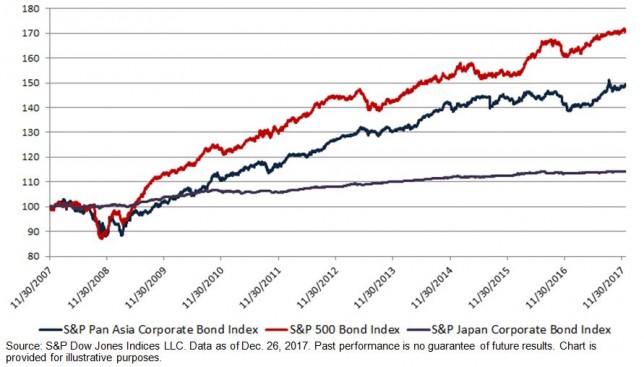
The S&P Pan Asia Bond Index, which seeks to track local currency bonds in 10 countries and is calculated in USD, reversed its loss in 2016 and delivered a total return of 7.86% in 2017. Meanwhile, its yield-to-maturity widened 123 bps to 4.64% YTD. The S&P Pan Asia Corporate Bond Index outperformed the S&P Pan Asia Government Bond Index and gained 8.30% over the same period. The size of Asia’s local currency bond markets, as measured by the S&P Pan Asia Bond Index, continued to expand and grew 17% to reach USD 12.1 trillion in 2017.
The 10 country-level bond indices calculated in local currencies ended the year with mixed returns. The three outperforming countries within the S&P Pan Asia Bond Index were Indonesia, Malaysia, and India. The S&P Indonesia Bond Index jumped 15.25% in 2017, while its yield-to-maturity tightened 16 bps to 6.35%, making Indonesia the best-performing country in Pan Asia for the year. The S&P Malaysia Bond Index rose 5.19% YTD, while its yield-to-maturity tightened 2 bps to 3.88%. The S&P BSE India Bond Index gained 4.21% YTD, and its yield-to-maturity widened 24 bps to 7.47%.
The S&P China Bond Index lost 0.29% in 2017; it was the only country within Pan Asian bond markets that posted a negative return. Meanwhile, its yield-to-maturity widened 19 bps to 4.77%. The performance of the S&P South Korea Bond Index also lagged other countries, but it was still up 0.53% YTD (see Exhibit 1).
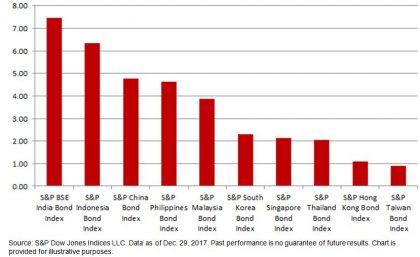
Looking at the yield-to-maturity in Exhibit 2, India had the highest yield, at 7.47%, followed by Indonesia with 6.35%, and China with 4.77%. On the other hand, the lowest-yielding country was Taiwan with 0.89%, followed by Hong Kong, which was slightly higher at 1.10%.
Exhibit 1: Total Return of the S&P Pan Asia Bond Index Family in 2017
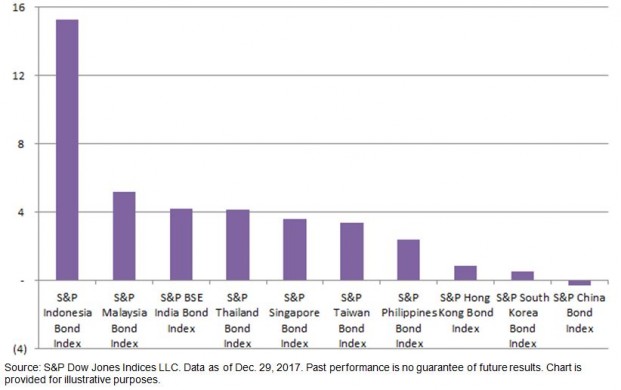
Exhibit 2: Yield-to-Maturity of the S&P Pan Asia Bond Index Family in 2017