As we rapidly approach Christmas and New Year (not to mention year-end evaluations) it seems fitting to reflect on what happened in 2017. We will publish our regional month-end dashboards on December 29 (interested parties may sign up here). Before then, here are a few highlights using data as of December 15.
Volatility was historically low this year.
There was unusually low volatility in U.S. equities, with daily volatility in the S&P 500® in 2017 being lower than in any other year since 1965. Meanwhile, the volatility in the S&P Europe 350 was lower than in any full year since the index launched in 1998.
Underlying the dampened risk environment was a series of political risks that failed to manifest: victories for the favorite candidates in Dutch, French, German and Japanese elections contrasted with the surprises of 2016. Diversification also played a part, as ultra-low stock-to-stock correlations meant winners and losers among individual stocks balanced each other out in the benchmark’s performance. Market participants also seemed intensely relaxed about the expected impact of anticipated news-flow on S&P 500 constituents, as seen in VIX®. So far this year, VIX recorded 48 of the lowest ever 57 closing VIX levels, as well as two new all-time low closing levels. This environment helped the S&P 500 VIX Short Term Futures Inverse Daily Index to a 187.10% year-to-date total return.
Exhibit 1: Average 30-day realized volatility in the S&P 500 for each year since 1957.
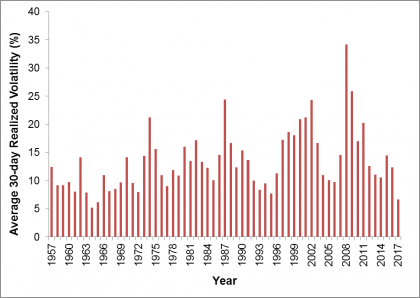
Source: S&P Dow Jones Indices. Data from March 4, 1957 to December 15, 2017. Past performance is no guarantee of future results. Chart is provided for illustrative purposes.
The U.K. equity market was impacted by the relative value of the Pound Sterling.
The U.K.’s currency acted as a barometer for investors’ confidence in the ability of the U.K. Government to negotiate its exit from the European Union. The weak and wobbly value of the pound that followed Prime Minister Theresa May’s surprise decision to call a General Election, and the subsequent loss of her party’s majority, helped the S&P United Kingdom BMI (denominated in pounds) to outperform its euro denominated counterpart. There was a turnaround towards the end of the year, though, when the Bank of England’s decision to raise interest rates for the first time in a decade lifted sterling against the euro.
Exhibit 2: cumulative total returns to the S&P United Kingdom in euros and pounds.
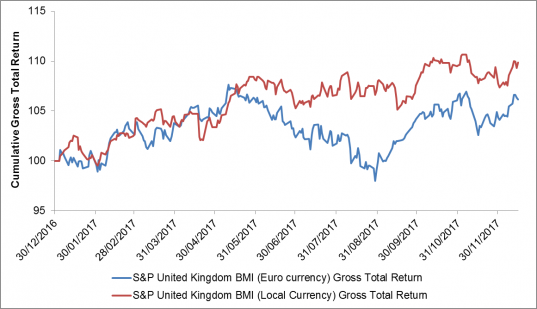
Source: S&P Dow Jones Indices. Data from December 30, 2016 to December 15, 2017. Index levels rebased at December 30, 2016. Past performance is no guarantee of future results. Chart is provided for illustrative purposes.
Momentum managed to identify the trends.
With the low volatility environment and an upward trend in U.S. equities, the S&P 500 Momentum Index was the best returning S&P 500 “smart beta” strategy in 2017; as of December 15 it had gained 28.68%. Elsewhere, there was a 47.04% year-to-date rise in the S&P BSE Momentum Index while momentum even performed well in Japanese equities; the S&P Momentum Japan LargeMidCap increased 22.85% since the end of 2016.
And finally…
2017 was quite the year for the S&P/NZX Farmer’s Weekly Agriculture Equity Investable Index; it rose 72.06% to make it the best performing index we report on in any of our regional dashboards. Among the worst performers on our regional dashboards is the S&P/TSX Capped Energy (in US dollars) which declined 16.85% year-to-date.
The posts on this blog are opinions, not advice. Please read our Disclaimers.