Get Indexology® Blog updates via email.

In This List

Inside the S&P 500®…. Bonds!

A Closer Look at India SPIVA Year-End 2014

Inside the S&P 500: Adds, Drops and Tall Tales

Greece And The ECB: What Precedent Will Be Set For The Eurozone?

Disruptive Opportunities for Nimble Advisors

Inside the S&P 500®…. Bonds!

Contributor Image
David Blitzer

Former Managing Director and Chairman of the Index Committee

S&P Dow Jones Indices

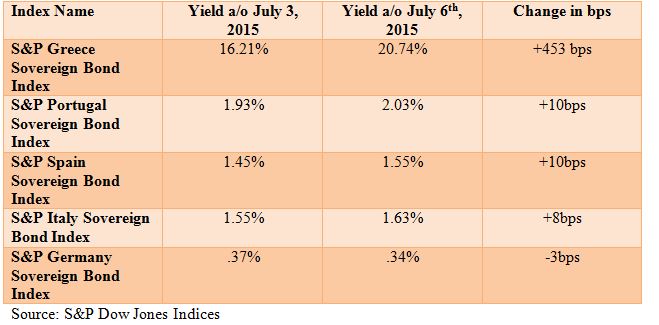
The companies in the S&P 500 are often described as leading companies in leading industries.  The S&P 500 is the go-to index for analyzing, tracking and understanding large cap stocks in the US market.  Its history goes back over 50 years to 1957 and its predecessor indices extend back to 1923 and 1926. Only the Dow claims a longer heritage. With about 50% of the revenues of the S&P 500 companies coming from overseas, the index is also a leading benchmark for developed markets worldwide.  Until now one thing has been missing – many of these 500 companies raise capital in the fixed income markets as well as in the equity markets.

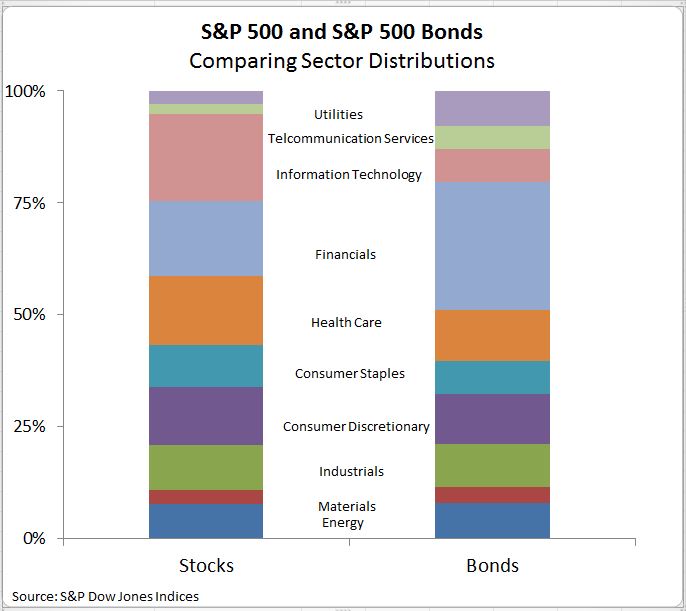
S&P Dow Jones Indices is introducing a bond index covering the 500 companies in the S&P 500 (equity) index.  The index will include all publicly traded bonds issued in the US by companies in the S&P 500.  This is about 4,760 issues covering some $3.7 trillion of debt. The combination of the stock and bond indices makes possible consistent analyses of the two most important asset classes for investors. By anchoring both indices in the same list of leading companies the two indices will provide a more complete picture of the financial condition of large cap corporations in the US.  The distribution of debt and equity among companies and sectors differs and a comparison of the indices highlights these differences. On the bond side the largest sector measured by the market value of bonds is financials, followed by consumer discretionary.   Financials are also high on the equity list at number two by market value. However, the largest in equities, information technology, is the seventh by size in bonds.  Health care is the third largest sector in both the S&P 500 and the S&P 500 Bond index.  Telecommunication services is the smallest equity sector and the second smallest bond sector.  The chart compares the sector shares in the two indices.

In fixed income analyses of bonds, a primary division is between financial and nonfinancial corporations. Using this division and data from the Federal Reserve, bonds issued by nonfinancial companies in the S&P 500 represent about 59% of nonfinancial corporate bonds while bonds issued by financial companies represent about 23% of the financial bond market. On the equity side, the S&P 500 represents about 80% of the total market value of equity of US corporations.

There are many ways to divide or classify the issues in the S&P 500 Bond index that can’t be done with equities. These can add to our understanding of both bonds and stocks.  The bond ratings and the distribution of the ratings gives a picture of the overall credit quality of the S&P 500.  About 94% of the market value of the debt is rated investment grade, a good report card for this group of companies. Possibly less inspiring is the percentage of market value that receives the highest rating of AAA: 1.4%.   The maturities range from one month to almost 96 years.  By market value 41% is less than five years, 31% is between five and ten years and the balance are over ten years.  There are nine issues with maturities longer than 80 years including one at almost 96 years. These long lived issues include a bank, a railroad, a health care company and some industrials.

The posts on this blog are opinions, not advice. Please read our Disclaimers.

A Closer Look at India SPIVA Year-End 2014

Contributor Image
Utkarsh Agrawal

Associate Director, Global Research & Design

S&P Dow Jones Indices

The debate on the merits of active versus passive fund management can be a contentious topic and most recently was so for S&P DJI’s most recent SPIVA India Scorecard.  To that end, it might be helpful to review some of the provisions of the CFA Institute’s 2010 edition of the Global Investment Performance Standards (GIPS) regarding calculation methodology and composite construction, including the following.

  • Calculation methodology
    • A.1: Total returns must be used.
    • A.6: Composite returns must be calculated by asset-weighting the individual portfolio returns using beginning-of-period values or a method that reflects both beginning-of-period values and external cash flows.
  • Composite construction
    • A.6: Terminated portfolios must be included in the historical performance of the composite up to the last full measurement period that each portfolio was under management.

For the India SPIVA report, we use total returns for comparison purposes, since these include income from dividends, and we include merged or liquidated funds. We choose the benchmark indices to be representative of the segment in which each fund invests. We also take the oldest share class per fund to avoid double counting.

To compute survivorship, we calculate the number of funds that were either merged or liquidated during the evaluation period. For example, for the five-year period ending December 2014, we found that the survivorship rate was 80.30% for the Indian large-cap actively managed mutual funds. What this means is that out of the total available funds, which were 102 at the beginning of the period, 20 funds were either merged or liquidated during the five-year period.

To compute outperformance, we compare each individual fund’s returns with those of the relevant benchmark, after removing those funds for which data is not available. We use the total returns of the benchmark for comparison purposes. For example, for the five-year period ending December 2014, we found that 52.94% of the Indian Equity Large-Cap actively managed mutual funds could not keep up with the S&P BSE 100. What this means is that out of the total available funds, which were 102 at the beginning of the period, 54 funds underperformed the S&P BSE 100. The returns of each individual fund were compared with those of the S&P BSE 100 to arrive at this statistic. This has nothing to do with equal-weighted or asset-weighted returns. These 54 funds also include the 20 funds that were either merged or liquidated because excluding them would inflate the perception of success.

In addition, we calculate equal-weighted fund returns based on the monthly returns of each fund. We did not include the asset-weighted returns, given there is limited data available to calculate asset-weighted returns since only the quarterly average of the assets under management is available for evaluation from the Association of Mutual Funds of India.

Nevertheless, let’s look at asset-weighted returns based on the quarterly average assets under management (see Exhibit 1). In this case, the share class with the highest quarterly average assets under management at the beginning of the period was identified for each fund and then the asset-weighted returns were calculated.

Exhibit 1: Asset-Weighted Fund Returns
S&P Index with Respective Peer Group One-Year (%) Three-Year Annualized (%) Five-Year Annualized (%)
S&P BSE 100 34.19 24.04 10.97
Indian Equity Large-Cap 45.50 25.57 12.53
S&P BSE 200 37.44 24.76 11.10
Indian ELSS 51.86 29.42 14.05
S&P BSE MidCap 48.63 31.72 12.91
Indian Equity Mid-/Small-Cap 72.35 36.51 17.24
S&P BSE India Government Bond Index 15.72 10.05 8.50
Indian Government Bond 16.10 9.46 7.42
S&P BSE India Bond Index 15.42 10.14 8.62
Indian Composite Bond 12.44 9.07 7.84

Source: S&P Dow Jones Indices LLC, Morningstar, Association of Mutual Funds of India.  Data as of Dec. 31, 2014.  All returns in INR.  Past performance is no guarantee of future results.  Table is provided for illustrative purposes. 

We can observe that the five-year asset-weighted returns for the actively managed Indian Government Bond funds and the Indian Composite Bond funds are less than their respective benchmarks, the S&P BSE India Government Bond Index and the S&P BSE India Bond Index. In the case of the actively managed equity mutual funds, all the fund categories have higher five-year asset-weighted returns than their respective benchmarks. The equal-weighted returns presented in the India SPIVA Year-End 2014 report told the same story, except for the Indian Equity Large-Cap funds.

We can observe that the asset-weighted returns for the actively managed Indian Equity Large-Cap funds were almost 1.56% more than S&P BSE 100, indicating that the larger funds led the rally. Let’s break down the statistics of this fund category into quartiles by the asset size (Exhibit 2). The calculation used the share class with the highest quarterly average assets under management at the beginning of the five-year period for each fund for which the average asset under management was available.

Exhibit 2: Indian Equity Large-Cap Funds Over a Five-Year Period
Quartile Percentage Outperformed by S&P BSE 100 (%) Survivorship (%) Equal-Weighted Returns Five-Year Annualized (%) Asset-Weighted Returns Five-Year Annualized (%)
1 40.00 88.00 11.81 12.70
2 32.00 92.00 12.25 12.58
3 80.00 60.00 10.41 11.34
4 79.17 62.50 10.17 10.49

Source: S&P Dow Jones Indices LLC, Morningstar, Association of Mutual Funds of India.  Data as of Dec. 31, 2014.  All returns in INR.  Past performance is no guarantee of future results.  Table is provided for illustrative purposes. 

We can notice that, even in the first and second quartile, which consists of the largest funds by asset size, the S&P BSE 100 outperformed 40% and 32% of the funds over the five-year period ending December 2014. Over the same period, within the third and fourth quartile, the majority of the funds were outperformed by their respective benchmark. The equal-weighted asset returns of the first quartile were less than the second quartile by 44 bps whereas the asset-weighted returns of the first quartile were more than the second quartile by only 12 bps over the same five-year period. Even the survivorship percentage of the second quartile was better than the first quartile.

Therefore, it is evident that not all the funds outperformed the benchmark on the basis of having the largest asset size

The posts on this blog are opinions, not advice. Please read our Disclaimers.

Inside the S&P 500: Adds, Drops and Tall Tales

Contributor Image
David Blitzer

Former Managing Director and Chairman of the Index Committee

S&P Dow Jones Indices

Each year about 20 to 25 stocks leave the S&P 500 and are replaced with other stocks that meet the guidelines for index membership.  These changes are usually announced five trading days before the index change. Given the size of the asset pool that tracks the S&P 500 — ETFs, index funds and institutional portfolios – about 11% of the float shares of each stock in the index is in index tracking portfolios.

The idea that 11% of a stock’s shares may be bought over five days suggests to some people that buying will surge and push the price up.  The reaction of stock prices to index adjustments has been studied several times dating back to the mid-1980s.  The extent of any price increase varied in the last 30 years and has declined in the past ten years.  Recently the effect is a few percentage points, or less. Moreover, any bump up is temporary. A few weeks after a stock joins the S&P 500 there is no last effect and its price, adjusted for overall market movements, is back to normal.

Still, the idea that one could profit from buying a stock as soon as possible after an addition is announced and then selling it when it enters the index is tempting.  To see if this could work, I looked at the 13 adds to the S&P 500 in the first half of 2015. There are 13 stocks added to the index.  Since the announcements are made at 5:15 PM New York time, the strategy is buying at the open on the next trading day after the announcement and selling at the close on the day the stock enters the index.  The closing price is the price S&P DJI uses to adjust the index divisor – if an ETF trades at that price they avoid any tracking error. How did it work? Of the 13 additions, six would have lost money and seven would have made money. The odds of coming out ahead aren’t very good. If you bought and sold one share of each addition you would have ended up with a profit of $8.81. However, you would have needed capital of about $540 because four adds had overlapping dates.  The return on your capital would have been 1.7%.  Doing this analysis completely would require a detailed event study covering much more than six months and adjusting stock prices to isolate the effect of index fund buying from overall market movements. Such studies have been done and they suggest, as did the example, that there isn’t any free money lying around.

The test case just discussed assumes that an index fund portfolio manager only buys at the closing price on the implementation date.  A portfolio manager running an S&P 500 fund is not constrained to buy only at the close on the day the stock is added to the index. He or she can buy at any time; can spread their purchases over a few days or weeks if they believe they will get a better price.  The flexibility gives the portfolio manager an opportunity to time the buying to his advantage and use his understanding of the index.  Some hedge fund managers and speculators do buy when an index add is announced and expect to sell to an index fund a few days later.  Some may also forecast (guess) what stock will be added next and buy in advance.  All this activity increases the liquidity of the stock being added and can dampen any price movements.

To conclude, and as the old saying goes, there ain’t no free money to be found in the stock market. And to believe that index fund managers are at the mercy of hedge funds or alleged front runners, well that’s just a tall tale.

The posts on this blog are opinions, not advice. Please read our Disclaimers.

Greece And The ECB: What Precedent Will Be Set For The Eurozone?

Contributor Image
Heather Mcardle

Director, Fixed Income Indices

S&P Dow Jones Indices

Greece has voted “no” to a referendum on further austerity measures proposed by the ECB. Greek PM Tsipras wanted this result, in order to gain more bargaining power with creditors. The ECB reacted accordingly, and placed steeper haircuts on collateral for emergency funding.   This puts additional pressure on a banking system that is already in deep distress. Today, finance ministers from across Europe are meeting to discuss next steps.

On Monday, European government bond markets reacted as expected, with a flight to quality and a sell-off of riskier assets. The reaction was more subdued outside of Greece, than one would expect, as a Grexit seems more probable. The S&P German Sovereign Bond Index rallied, with yields tightening 3bps, while the S&P Portugal Sovereign Bond Index sold off, with yields widening 10bps. The S&P Spain Sovereign Bond Index widened 10bps, and the S&P Italy Sovereign Bond Index widened 8bps. The Greek Sovereign Bond Index continues its descent, with yields widening 452bps to close at 20.74%.

The performance of these markets indicates that systemic contagion is not a huge concern. What is a concern, however, is the precedent that will be set for other Eurozone countries with struggling economies. If Greek’s hardball tactics end up giving them a degree of debt relief, and/or looser austerity measures, there could be incentive for Portugal, Spain and Italy to change their compliance with austerity measures. This has serious implications for the euro’s stance as a reserve currency.

A growing concern in Europe, is a possible shift in power to anti-austerity political parties outside of Greece. Portuguese Deputy PM Paulo Portas felt the need to comment Monday, saying that his government is committed to austerity plans and intends to stay on track. Portas was responding to Portugal’s socialist leader Antonio Costa, who is calling for Portugal to show more solidarity with Greece. Spain has a very outspoken, rising anti-austerity party called the Podemos. The Podemos, the second largest political party in Spain, is gaining momentum as it appeals to a society that has engaged in years of unpopular austerity measures. Spanish elections are set for late fall, and the ECB’s actions over the next few days will surely be scrutinized.

Capture

The posts on this blog are opinions, not advice. Please read our Disclaimers.

Disruptive Opportunities for Nimble Advisors

Contributor Image
Adam Butler

CEO

ReSolve Asset Management

On June 24th, I had the privilege of participating in the inaugural Canadian S&P Dow Jones Indices ETF Masterclass conference on the topic “ETFs as a Catalyst for Canadian Advisory Growth”. While conversations orbited the general themes of ETFs and indexation, panelists and speakers touched on many topics Advisors are, or should be, thinking about as we approach a time of profound change in wealth management.

In recognition that Advisors’ time is valuable, and that many Advisors who might have been interested in attending the conference were unable to be there, I thought it might be useful to share the messages my colleagues and I thought were most surprising and important.

  1. Beth Hamilton Keen, CFA, Incoming Chair of the CFA Institute Board of Directors, shared a recent study that showed asset management ranking last, behind bankers, auto salespeople, and insurance brokers, in terms of perceived integrity. When prompted, the public pointed to a lack of ethical culture within financial firms as the primary source of concern. The CFA Institute, and other similar organizations like fi360, are rallying behind a proposal to “Put Investors First” to help the wealth management industry earn back investors’ trust. CRM2 regulations in Canada and proposed fiduciary standards for advisors in the U.S. are consistent with this objective. Advisors who continue to subordinate client needs to quarterly sales targets risk legal consequences and eventual obsolescence.
  2. There is a creeping recognition that the active managers Advisors have counted on for decades to help them differentiate their practice have not delivered. Clients are increasingly familiar with the low-cost, passive nature of ETFs, and are expressing a preference for Advisors who can speak intelligently about how to incorporate them into portfolios. Slowly but surely, Advisors who have no index/ETF based offerings are likely to find clients abandoning them for Advisors who do. Raymond Kerzérho, Director of Research at PWL Capital, discussed how his firm constructs globally diversified passive portfolios of ETFs to help take the emotions out of the investment process. Deborah Frame, VP and Portfolio Manager at Dundee Global Investment Managed described how her firm is taking an active approach to asset allocation through ETFs.

Panelists generally agreed that the proliferation of ETF offerings covering every corner of the equity, fixed income and alternative asset space represents an opportunity for those equipped to assemble products into coherent solutions. In some ways, it’s never been easier to build a diversified global portfolio. On the other hand, some advisors acknowledged that the ‘paradox of choice’ might lead to ‘paralysis by analysis’ as clients and advisors alike struggle to keep up with all the new offerings.

  1. There was a grudging agreement among all but the most die hard ‘pacifists’ (i.e. zealous passive investors) that a potential low return future across most asset classes would require a more active approach to asset allocation in order to meet client needs. Robyn Graham from Hahn pointed to her firm’s track record of navigating major global macroeconomic trends with diversified ETF portfolios to suit different client preferences. Deborah Frame presented a compelling case for quantitative approaches to asset allocation, which is well supported by research from firms like AQR.  James Morton highlighted some unique ‘quirks’ about ETFs that can trip up inexperienced advisors, and reminded everyone of the large and growing reporting burden for foreign holdings.

For our part, I explained how our product lineup is a continuum extending from the truly passive global market cap weighted portfolio at one end, through risk parity type and approaches, to pure tactical solutions at the ‘active’ extreme. I also made the point that portfolios can benefit from non-correlated strategies, such as CTA funds, for so-called ‘tail protection’ when things get ugly.

The posts on this blog are opinions, not advice. Please read our Disclaimers.