Get Indexology® Blog updates via email.

In This List

Deflation

Energy Bonds Are Now One of the Riskiest Sectors

A Strong U.S. Dollar Isn't Bad For All Commodities

The Rest of the Story

Global Forces At Work

Deflation

Contributor Image
David Blitzer

Former Managing Director and Chairman of the Index Committee

S&P Dow Jones Indices

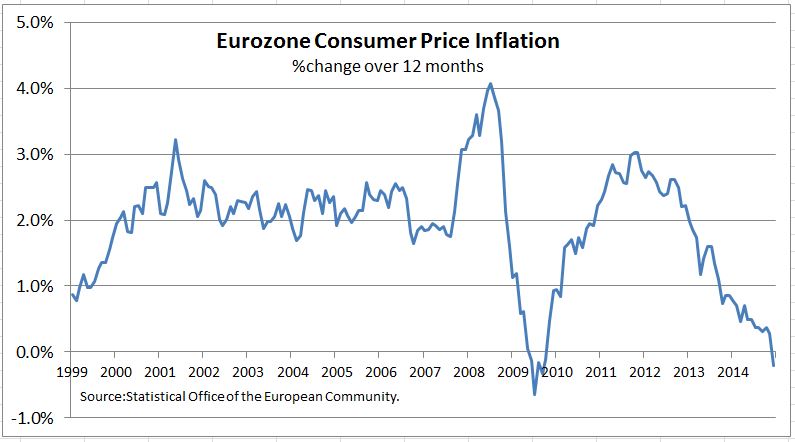
Times have changed: people of a certain age will remember when inflation was investors’ biggest worry, now in Europe the fear is deflation – falling prices.  The chart shows the rate of price change in the Eurozone since 2000. It has been falling steadily for over three years. With the December report out yesterday, prices are now falling.

Deflation now is a slow creeping problem rather than an imminent disaster.  However, as it continues it will squeeze the economy and shift consumer and business attitudes about spending and investment. If not reversed the damage could be long lasting.  Deflation’s principal issues are the impact on debt, on consumer spending and business investment and on the central bank policy.

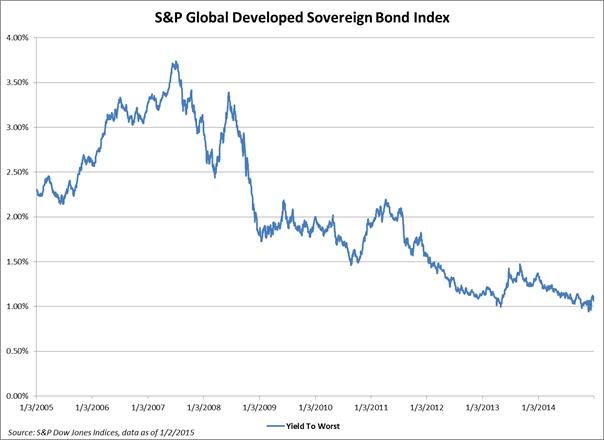
Deflation with its accompanying economic problems is a negative for stocks and is likely to weaken the euro further.  The only winners are bond holders – providing the bonds are repaid.

Debt deflation – when prices fall any financial instrument denominated dollars and not adjusted for deflation becomes more valuable.  Paying off debts, loans or bonds becomes more difficult as prices fall and their value rises. Businesses cut their prices and revenues fall while the real cost of debt service rises. Only if interest rates could fall below zero could debts adjust for deflation.  Debtors face increasing difficulties and potential borrowers are scared away by the high cost of debt.  Sectors of the economy where growth depends on credit suffer.  Housing would be one of the first hurt.

As prices fall, money becomes more valuable because the same number of dollars buys more.  Incentives to spend or invest whither as consumers and business recognize that it is easier and safer to leave money in the bank and watch it appreciate in value. Over time the economy would gradually grind to a halt.

Deflation is also a challenge for the central bank.  While prices drift down, advice to the European Central Bank (ECB) is mounting higher and higher.  The ECB is expected to implement quantitative easing, but it will face some challenges. First, the supply of bonds is smaller and more diverse than what the Fed bought in the US, making the program harder to implement and its impact harder to gauge. Secondly, Germany may try to block or limit quantitative easing out of fears that it would bailout debtor countries or sow the seeds of future inflation. Hopefully the ECB will move quickly and aggressively – the longer it waits, the worse will be consumer spending and business investment and the harder it will be to make any progress. Even an aggressive QE program may not work in the near term. Chances of successfully reversing deflation and avoiding recession without some fiscal stimulus are limited.


The posts on this blog are opinions, not advice. Please read our Disclaimers.

Energy Bonds Are Now One of the Riskiest Sectors

Contributor Image
J.R. Rieger

Former Head of Fixed Income Indices

S&P Dow Jones Indices

Data as of January 6, 2015

As oil prices have tumbled, the cost of buying default protection on the debt of energy companies has skyrocketed.  The cost of buying default protection tracked in the S&P/ISDA CDS U.S. Energy Select 10 Index has nearly tripled from a low point in June 2014.  As a result, default spreads for the energy sector are now higher than spreads for junk bonds indicating the energy sector is one of the riskiest sectors in the bond markets.

The S&P/ISDA CDS U.S. Energy Select 10 Index ended at 377bps up from 130bps in June 2014.  Translated into dollars, the annual cost of buying default protection on $10million of debt on these entities has risen from $139,000 to $377,000. The S&P/ISDA CDS U.S. High Yield Index ended at 334bps.

Source: S&P Dow Jones Indices LLC.  Data as of January 6, 2015.
Source: S&P Dow Jones Indices LLC. Data as of January 6, 2015.

The ten companies tracked in the S&P/ISDA CDS U.S. Energy Select 10 Index are:

  • Anadarko Petroleum Corp.
  • Apache Corp
  • Chesapeake Energy Corp.
  • ConocoPhillips
  • Devon Energy Corporation
  • Forest Oil Corp.
  • Halliburton Company
  • Peabody Energy Corporation
  • Valero Energy Corp.
  • Williams Companies, Inc. (The)


The posts on this blog are opinions, not advice. Please read our Disclaimers.

A Strong U.S. Dollar Isn't Bad For All Commodities

Contributor Image
Jodie Gunzberg

Former Managing Director, Head of U.S. Equities

S&P Dow Jones Indices

A strong US dollar is generally bad news for commodities since historically as the U.S dollar strengthens, goods priced in dollars become more expensive for other currencies. The historical negative relationship between the U.S. dollar and the S&P GSCI is shown below.

Source: S&P Dow Jones Indices and Bloomberg. Monthly data from 1/70 - 6/13. Charts and graphs are provided for illustrative purposes only.  Indices are unmanaged statistical composites and their returns do not include payment of any sales charges or fees an investor would pay to purchase the securities the index represents.  Such costs would lower performance.  It is not possible to invest directly in an index.  Past performance is not an indication of future results. The inception date for the S&P GSCI was May 1, 1991, at the market close.  All information presented prior to the index inception date is back-tested. There are inherent limitations associated with back-tested data.
Source: S&P Dow Jones Indices and Bloomberg. Monthly data from 1/70 – 6/13. Charts and graphs are provided for illustrative purposes only. Indices are unmanaged statistical composites and their returns do not include payment of any sales charges or fees an investor would pay to purchase the securities the index represents. Such costs would lower performance. It is not possible to invest directly in an index. Past performance is not an indication of future results. The inception date for the S&P GSCI was May 1, 1991, at the market close. All information presented prior to the index inception date is back-tested. There are inherent limitations associated with back-tested data.

While the broad based indices are negatively correlated with the U.S. dollar, some commodities are more negatively correlated with the US dollar than others.  In the long term, since the inception of each single commodity index, ten commodities have a lower than -0.3 correlation to the U.S. dollar: lead, copper, aluminum, nickel, gold, Kansas wheat, Brent, WTI, unleaded gasoline and gasoil with the lead leading the pack with the biggest negative relationship at -0.52.

Commodity Dollar Inc

When reducing the time period to ten years for all commodities, a different pattern appears. The first observation is that with the exception of feeder cattle, all correlations became more strongly negative.  However, some much more than others. Cocoa, corn, heating oil, WTI, silver, soybeans and unleaded gasoline all has greater than -0.3 decreases in correlation, implying a stronger negative relationship with the U.S. dollar.  The five commodities of the petroleum complex have the greatest inverse sensitivity, ranging from -0.62 to -0.67.  On the other hand, it is not surprising to see zinc, natural gas, live cattle, lean hogs, sugar and feeder cattle with almost no correlation. With the exception of zinc, these commodities are highly sensitive to weather.  Other factors like transportability and the global usage (natural gas is local) may influence the relationship.10 yr USD Commodities


The posts on this blog are opinions, not advice. Please read our Disclaimers.

The Rest of the Story

Contributor Image
Craig Lazzara

Former Managing Director, Index Investment Strategy

S&P Dow Jones Indices

This morning’s Wall Street Journal offered a partial explanation for the failure of most active managers to outperform their cap-weighted index benchmarks in 2014.  The proffered explanation is that “the rally in U.S. stocks was generally led by giant-company shares, such as Apple Inc., which rose 40%.”  Since most active funds are underweight most mega-cap stocks, the argument goes, “it’s logical the S&P [500] would outperform most active funds.”

Apple’s 40.6% total return far outpaced that of the S&P 500 as a whole (13.7%), so an underweighted position in the Index’s largest holding would clearly have hurt in 2014.  The argument is fine as far as it goes — but it doesn’t go very far.  If it’s fair to note that Apple outperformed, it’s also fair to note that Exxon Mobil — the second largest holding in the S&P 500 — recorded a total return of -6.1%.  The impact of underweighting mega-caps depends on which mega-cap a manager chose to underweight.

An easy way to understand the overall impact of capitalization is to compare the total return of the S&P 500 (13.7%) with that of the S&P 500 Equal Weight Index (14.5%).  Since the two indices comprise the same stocks, the superior return of the equal weight version tells us that, in 2014, weighting by capitalization hurt performance — in other words, that Apple was the exception, not the rule.  That said, the 80 basis points spread is exceptionally narrow in historical terms.   Since 2002, the average spread between the equal- and cap-weighted S&P 500 has been 3.8%, with positive results in 10 out of 13 years.  This means that in most years, picking stocks randomly from among the constituents of the S&P 500 would have been a winning strategy.  The same was true in 2014, although to a lesser extent than typically.

In 2014 as in most prior years, the underperformance of the average active manager is striking.  And when random selection beats actual portfolio managers, their performance was even worse than you think.

The posts on this blog are opinions, not advice. Please read our Disclaimers.

Global Forces At Work

Contributor Image
Kevin Horan

Former Director, Fixed Income Indices

S&P Dow Jones Indices

Global yields have started the new year lower, as the yield of the S&P Global Developed Sovereign Bond Index was  1.05% as of Jan. 5, 2015.  The index did touch a low of 0.94% at the end of November before bouncing up to close 2014 at 1.08%.  Looking back 10 years, the yield was as high as 3.74% in July 2007.  For 2014, the total return of the index was 7.09%.

European sovereign bonds, as measured by the S&P Eurozone Developed Sovereign Bond Index, returned 12% for 2014.  The yield of this index as of Jan. 5, 2015, was 0.97%, a historic low given the available index history.  The bond rally and forex drop in value have been driven by fears of deflation and speculation that the European Central Bank will need to continue, if not increase, the purchasing of debt to stimulate the region’s economy.

The S&P/BGCantor Current 10 Year U.S. Treasury Index closed 2014 returning 11.10% for the year.  Similar to the global picture, the yield of the index began the year at 3.03% and closed the year at a 2.22%.  Since Dec. 31, 2014,  the yield of this index has moved down to 2.04% as of Jan. 5, 2015.  The slowing global economic growth and deflationary forces are driving overall demand for debt.  The increasing strength of the U.S. economy and the Fed’s message of higher rates are being overshadowed by the bigger global picture.

The S&P U.S. Issued Investment Grade Corporate Bond Index outshined the lower-credit S&P U.S. Issued High Yield Corporate Bond Index, as the search for yield remained important throughout the year, but was eventually overshadowed by risk-off trades in response to the drop in oil prices.  These indices closed 2014 returning 7.71% and 2.66%, respectively.

Senior bank loans, as measured by the S&P/LSTA U.S. Leveraged Loan 100 Index, struggled throughout the year.  Continued active issuance, which added to supply, and the same energy names that were affected by the drop in oil prices in the high-yield index combined to detract from the performance of the leveraged loan sector.  The S&P/LSTA U.S. Leveraged Loan 100 Index ended 2014 with a return of 1%.
S&P Global Developed Sovereign Bond Index-Yield History


The posts on this blog are opinions, not advice. Please read our Disclaimers.