The Indian Stock Market has continued to be volatile recently. The Lok Sabha election and the formation of the new Indian government boosted the stock market to an all-time high. The S&P BSE SENSEX Price Return Index surged and went beyond the threshold of 25,000 points. FII activity also increased with the positive sentiment and outlook of the stock market.
Looking at Exhibit 1, it is noticable that the cumulative net investment of FII in equity has been increasing, except in 2008 at the time of global recession. From Dec. 31, 2007, to April 30, 2009, the percentage decrease of the cumulative net investment of FII in equity was approximately 19%, while in the case of the S&P BSE SENSEX it was approximately 44%. The percentage decrease in the S&P BSE SENSEX was much greater than in the cumulative net investment of FII in equity. The question then arises: the stock market is affected by FII activity, but does it play a dominating role?
Exhibit 1: S&P BSE SENSEX and Cumulative Net Flow of FII in Equity
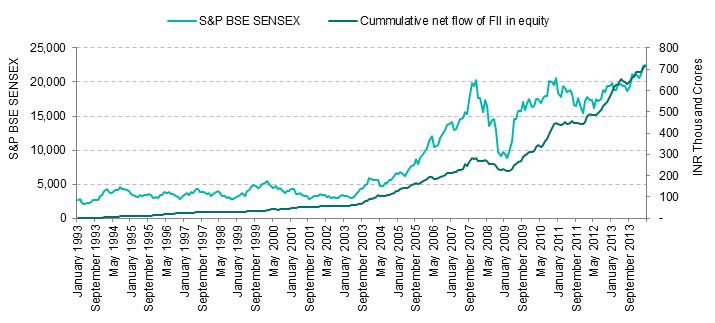
Source: AIPL and SEBI. Data as of last trading day in April 2014. Charts and graphs are provided for illustrative purposes. Past performance is no guarantee of future results. This chart may reflect hypothetical historical performance. Please see the Performance Disclosures for more information regarding the inherent limitations associated with back-tested performance.
Let’s examine the affect of FII activity by testing if the volatility of the return of the S&P BSE Indices is greater than the volatility of the percentage change in the cumulative net flow of FII in equity. We also examine what the correlation is between them.
Let the null hypothesis be that the variance of the return of the S&P BSE Indices is less than or equal to the variance of the percentage change in the cumulative net flow of FII in equity. The alternate hypothesis will be that the variance of the return of the S&P BSE Indices is greater than the variance of the percentage change in the cumulative net flow of FII in equity. The alternate hypothesis is what we are most interested in.
Assuming that the returns of the indices and the percentage change in cumulative net flow of FII in equity are normally distributed, the appropriate test statistic will be the F-Test. Let’s perform the test at 1% level of significance. If the test statistic is greater than the critical value, we reject the null hypothesis and accept the alternate hypothesis. Exhibit 2 displays the variances and Exhibit 3 displays the critical values at a 1% significance level and the computed test statistics.
| Exhibit 2: Sample Variance of Monthly Returns of the S&P BSE Indices and the Percent Change in Cumulative Net Flow of FII in Equity | |||||||
| Period | FII Net Flow* (%) | S&P BSE SENSEX (%) | S&P BSE 100 (%) | S&P BSE 200 (%) | S&P BSE 500 (%) | S&P BSE MID CAP (%) | S&P BSE SMALL CAP (%) |
| 3 Year | 0.0351 | 0.2256 | 0.2630 | 0.2656 | 0.2670 | 0.3726 | 0.4580 |
| 5 Year | 0.0599 | 0.3807 | 0.4212 | 0.4310 | 0.4412 | 0.6569 | 0.9015 |
| 10 Year | 0.0842 | 0.5324 | 0.5920 | 0.6095 | 0.6282 | 0.8477 | 1.1348 |
| 15 Year | 0.0844 | 0.5283 | 0.6530 | 0.6492 | 0.6699 | – | – |
| 20 Year | 0.0958 | 0.5344 | 0.6192 | 0.6191 | – | – | – |
Source: AIPL and SEBI. Data as of last trading day in April 2014. FII Net Flow* is the monthly percentage change in the cumulative net flow of FII in equity. Charts and graphs are provided for illustrative purposes. Past performance is no guarantee of future results. This chart may reflect hypothetical historical performance. Please see the Performance Disclosures for information regarding the inherent limitations associated with back-tested performance.
| Exhibit 3: F-Test Statistic of Monthly Returns of the S&P BSE Indices and the Percent Change in Cumulative Net Flow of FII in Equity | |||||||
| Period | S&P BSE SENSEX | S&P BSE 100 | S&P BSE 200 | S&P BSE 500 | S&P BSE MID CAP | S&P BSE SMALL CAP | F Critical* |
| 3 Year | 6.4341 | 7.5028 | 7.5750 | 7.6157 | 10.6273 | 13.0634 | 2.2309 |
| 5 Year | 6.3500 | 7.0256 | 7.1892 | 7.3602 | 10.9578 | 15.0381 | 1.8459 |
| 10 Year | 6.3228 | 7.0304 | 7.2387 | 7.4601 | 10.0674 | 13.4760 | 1.5358 |
| 15 Year | 6.2564 | 7.7327 | 7.6888 | 7.9333 | – | – | 1.4178 |
| 20 Year | 5.5784 | 6.4631 | 6.4625 | – | – | – | 1.3523 |
Source: AIPL and SEBI. Data as of last trading day in April 2014. F Critical* is at 1% level of significance. The F-Test statistic is calculated by dividing the sample variance of the monthly returns of the index by the sample variance of the monthly percentage change in the cumulative net flow of FII in equity. Charts and graphs are provided for illustrative purposes. Past performance is no guarantee of future results. This chart may reflect hypothetical historical performance. Please see the Performance Disclosures for information regarding the inherent limitations associated with back-tested performance.
The results in Exhibit 3 lead us to reject the null hypothesis for all periods and for all indices, as the test statistics computed are greater than the corresponding critical value. Therefore, we conclude that the volatility of the returns of the S&P BSE Indices is greater than the volatility of the percentage change in the cumulative net flow of FII in equity.
| Exhibit 4: Correlation Between Monthly Returns of the S&P BSE Indices and the Percent Change in Cumulative Net Flow of FII in Equity | ||||||
| Period | S&P BSE SENSEX (%) | S&P BSE 100 (%) | S&P BSE 200 (%) | S&P BSE 500 (%) | S&P BSE MID CAP (%) | S&P BSE SMALL CAP (%) |
| 3 Year | 43.70 | 46.97 | 48.78 | 49.40 | 55.17 | 46.09 |
| 5 Year | 58.70 | 59.40 | 60.55 | 61.00 | 63.25 | 59.27 |
| 10 Year | 64.56 | 64.66 | 65.15 | 65.40 | 64.73 | 59.91 |
| 15 Year | 56.19 | 52.26 | 52.18 | 51.94 | – | – |
| 20 Year | 46.85 | 43.98 | 43.57 | – | – | – |
Source: AIPL and SEBI. Data as of last trading day in April 2014. Charts and graphs are provided for illustrative purposes. Past performance is no guarantee of future results. This chart may reflect hypothetical historical performance. Please see the Performance Disclosures for information regarding the inherent limitations associated with back-tested performance.
From Exhibit 4, we can observe that the correlation between the return of the S&P BSE Indices and the percentage change in the cumulative net flow of FII in equity is also less than 70%, thus failing to be statistically strong.
These results lead us to conclude that FII activity affects the stock market, but it has not played a dominating role.
The posts on this blog are opinions, not advice. Please read our Disclaimers.