Get Indexology® Blog updates via email.

In This List

The Gold War of India's Policy vs. U.S. Economy

U.S. Investment Grade Corporates Are Performing Well, Does A Euro Rate Cut Follow The Recent Dip?

Something’s Missing in the Housing Recovery

After May Showers, CDS Markets Are Feeling Sunny About Summer

Building the Indian Skyline

The Gold War of India's Policy vs. U.S. Economy

Contributor Image
Jodie Gunzberg

Former Managing Director, Head of U.S. Equities

S&P Dow Jones Indices

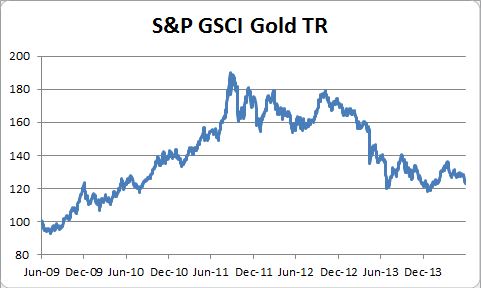
The S&P GSCI Gold lost 3.9% in May and has hit its lowest index level since January.

Source: S&P Dow Jones Indices and Bloomberg. Data from Jun 2009 to May 2014. Past performance is not an indication of future results. This chart reflects hypothetical historical performance. Please note that any information prior to the launch of the index is considered hypothetical historical performance (backtesting).  Backtested performance is not actual performance and there are a number of inherent limitations associated with backtested performance, including the fact that backtested calculations are generally prepared with the benefit of hindsight.
Source: S&P Dow Jones Indices and Bloomberg. Data from Jun 2009 to May 2014. Past performance is not an indication of future results. This chart reflects hypothetical historical performance. Please note that any information prior to the launch of the index is considered hypothetical historical performance (backtesting). Backtested performance is not actual performance and there are a number of inherent limitations associated with backtested performance, including the fact that backtested calculations are generally prepared with the benefit of hindsight.

This questions whether gold can recover after its biggest historical drop since 1981.  According to the Federal Reserve, the U.S. economy is strengthening, labor market conditions are improving and inflation has been low in the expanding economy.  According to Yellen, “looking ahead, I expect that economic activity will expand at a somewhat faster pace this year than it did last year, that the unemployment rate will continue to decline gradually, and that inflation will begin to move up toward 2 percent.”

These comments don’t fare well for gold so India’s import policy may be its only hope for price recovery.  Below is a summary of questions from a recent interview about the driving forces of gold.

Gold prices have cooled off in recent weeks and are hovering at around $1280-1290 an oz. The price is much below the year-before when levels of about $1380-1400 was seen in May 2013. What according to you is causing weakness in gold prices?  The idea of gold as a safe haven means investors have used gold as a store of value.  As the Fed tapers, the risk-off environment is subsiding with a potentially improving U.S. economy and stronger dollar, so the demand for gold as a safe haven has declined putting pressure on the price.

What are the factors that can help gold prices recover from these levels? Do you see that happening any sooner? A crisis might drive up demand for gold, which we have seen in mini waves as compared with the sizable global financial crisis. Recently spikes occurred from the tensions between Ukraine and Russia.  Other supporting factors could be if Indian imports improve from lesser restrictions or if the Chinese local premiums increased to about double their current $3 levels over the global benchmark.

India has been a major gold consumer globally. The Indian government had taken measures to restrict gold imports to bring current account deficit under control. Are these measures hurting the gold market globally? How do you think Indian policies with regard to gold play a role in global price determination? Anytime an outside force interferes with the supply and demand equilibrium, there is an impact.  India’s restriction on gold imports has had an adverse effect on the price of gold by fundamentally enlarging the supply pool in circulation – or in other words –  restricting demand from the world’s second largest consumer.

What are your views about the industrial metals’ demand and supply scenario for the rest of the year? Do you think Chinese demand and inventory built-up would continue this year for copper and other metals? With low inventories across the commodity complex, industrials are more susceptible to supply shocks than demand drops. Opposite from the impact on gold price from India’s import restriction is the positive price impact of the Indonesian export ban of nickel on nickel price, which is up 38.1% in the S&P GSCI in 2014.

What kind of movement in demand and prices do you expect in overall commodities market during this year?  The Chinese demand is having less of an impact on prices than the supply shocks since the inventories are low. The storage situations turned to shortages with diminished cushions to soften the blows of the shocks. This is a favourable environment for commodities from the combination of possible inflation and interest rate rises in conjunction with low inventories driving down correlations and up returns, again from supply shocks. We also may be at a turning point in the equity/commodity cycle that can be reflected through higher commodity performance than equity performance for the first time after six years.

How much importance does Indian commodities market hold in global markets? Is the new government formation in India going to affect commodities market globally? How? India is an important consumer of commodities, though the futures market is not yet developed enough to have contracts included from local exchanges in major indices. If the new government creates growth that may help the economically sensitive commodities like energy and industrial metals, but if there is turmoil, then gold may get a boost.

Several foreign investors and trade participants have shown lack of confidence in India’s commodity exchanges, as the largest exchange in India, Multi-Commodity Exchange (MCX) is facing legal issues with its promoter getting arrested for allegations of financial scam. Has it affected the confidence of market participants and investors overseas? The market impact of investor confidence is difficult to attribute to isolated factors, especially on less developed exchanges. Again, generally, if investors feel fear, they may flee to gold as a safe haven rather than economically sensitive commodities.

The posts on this blog are opinions, not advice. Please read our Disclaimers.

U.S. Investment Grade Corporates Are Performing Well, Does A Euro Rate Cut Follow The Recent Dip?

Contributor Image
Kevin Horan

Former Director, Fixed Income Indices

S&P Dow Jones Indices

The month of May closed on a high note for bonds as the drop in yields saw the S&P/BGCantor Current 10 Year U.S. Treasury Index closed at a yield of 2.47%.  Treasuries as measured by the S&P/BGCantor U.S. Treasury Bond Index returned 0.7% for the month and 2.12% year-to-date.

As of today, the yield on the 10-year is back up to 2.52% neighborhood after dipping down to 2.4%. Last week’s rally in all sovereign bonds is looking a bit reactionary to economic growth concerns both domestic and abroad.  Focus remains on the monetary stimulus expected by the European Central Bank this week as global central banking activity has been very accommodative and does not appear to be changing any time soon.

The U.S. economic calendar for this week started today with ISM Manufacturing at 53.4 versus the expected 56.2 and ISM Prices Paid at 60 versus the expected 57.  Construction Spending for April also came at a 0.2% which was expected to be at a 0.6%.  Tomorrow’s Factory Orders (0.5%, expected) and Wednesday’s MBA Mortgage Applications (-1.2%, prior), along with ADP Employment Change (213k, exp.) and Nonfarm Productivity (-3%, exp.) will help fill in the picture.  Thursday’s Initial Jobless Claims (310k, exp.) leading into Friday’s Change in Nonfarm Payrolls (215k, exp.) and the Unemployment Rate for May (6.4%, exp.) will be key determinants to the strength, or weakness, of the labor markets.

Investment grade corporates as measured by the S&P U.S. Issued Investment Grade Corporate Bond Index performed very well as the index returned 1.36% for the month and has returned 5.49% year-to-date.  2014’s return has been the best May year-to-date return since the 7.53% return of 2002.

Both the S&P U.S. Issued High Yield Corporate Bond Index and the S&P/LSTA U.S. Leveraged Loan 100 Index ended the month of May with total returns under 1%.  The indices returned 0.99% and 0.76% respectively month-to-date.  Numerous new high yield issues continued to come to market in names such as Audatex North America Inc., Baytex Energy, Cedar Fair, Interface Master Holdings Inc. and Precision Drilling.  Year-to-date the S&P U.S. Issued High Yield Corporate Bond Index has returned 4.69% while loans is lagging behind returning 1.91%.

Last week the S&P U.S. Preferred Stock Index (TR) returned 0.73% for the week adding to the month-to-date return of 1.36% and topping out at a year-to-date return of 10.40% for the month.  Comparing this hybrid bond/equity product to the S&P 500, the performance outshines the equity index which returned 2.35% for May and 4.97% year-to-date on a total rate of return basis.


Source: S&P Dow Jones Indices, Data as of 5/30/2014, Leveraged Loan data as of 5/31/2014.

The posts on this blog are opinions, not advice. Please read our Disclaimers.

Something’s Missing in the Housing Recovery

Contributor Image
David Blitzer

Former Managing Director and Chairman of the Index Committee

S&P Dow Jones Indices

The two most popular comments about the housing recovery are that it’s weak and the reason why GDP growth is so slow.  There is some truth to both of these — the problem is new single family homes. Looking across housing, one sees surprisingly strong construction of apartments, progress in working through the backlog of foreclosures as banks sell real estate they don’t want to own and increasing sales of existing homes.  Prices of existing single family homes, helped by low mortgage rates and improved consumer confidence rose 12.5% in the year ending in March.

Capture1

All this is positive, but without growth in new single family homes, GDP growth lags.  New construction, not sales of existing homes, is what generates jobs and adds to GDP growth.  In most recoveries, the share of single family homes in housing starts (see first chart) surges. This time, there was an initial surge followed by a sharp drop.  While apartment construction is up, it has not made up the difference in housing starts which continue at about two-thirds the level we should be seeing.

Capture2

There are lots of reasons, but no one big reason for the softness. Mortgages rates are low, but banks are still reticent about loans.  Many potential home buyers may have little borrowing capacity due to recent car purchases or student debts.  The New York Times noted that the number of foreclosed homes sold by banks has been substantially greater than the number of new homes sold by builders in recent years.  While these factors will be resolved over time, there are questions about demographic shifts that could mean less building of single homes in the future.  Will people prefer renting to buying because they expect their employment to change more often or will their preferences shift to urban living from suburbia?  As the baby boomers begin to retire, will they ignore retirement communities and head to new downtowns in revived cities?  This may seem farfetched to some observers. However, suburbia and universal car ownership didn’t really exist before the Second World War, so single family homes could change again.

The posts on this blog are opinions, not advice. Please read our Disclaimers.

After May Showers, CDS Markets Are Feeling Sunny About Summer

Contributor Image
Tyler Cling

Senior Manager, Fixed Income Indices

S&P Dow Jones Indices

Over the course of a month when Mother Nature could not decide which season it was in New York City, credit market swap (CDS) market participants as a whole decided credit default insurance was too high. CDS benchmark indices like the S&P/ISDA U.S. 150 Credit Spread Index tightened 4.9%. Every sector spread that compiles the S&P/ISDA 100 CDS Index (-4.9%) was down in May, except for the U.S. S&P/ISDA CDS U.S. Consumer Staples Select 100 Index (up 1.0%). Market indicators suggest that investors believe the relative risk of insuring the underlying credits in nearly every sector has dropped, or that these underlying credits are willing to take on more risk at a lower yield.

tylerchart1

A warmer outlook and a sunny forecast often come hand in hand, however it is important to remember they are independent events. The S&P/ISDA CDS U.S. Energy Select 10 which saw the biggest drop in spreads this month, is still trading above 140 basis points (bps) on notional credit (i.e. default protection on a loan of $1 million would cost $14,000). Last week, I commented on the dichotomy of trends within the sectors the market views as riskier, as determined by default spreads.

tylerchart2

The S&P/ISDA CDS U.S. Homebuilders Select 10 Index (-9.92 bps) and S&P/ISDA CDS U.S. Consumer Discretionary Select 20 Index (-11.64 bps) sectors, tightened in May, yet continue to be priced as premium risk sectors against their cheaper peers. The health care and European banks sectors saw greater relative spread declines, at -3.09 bps and -7.5 bps, respectively; S&P/ISDA CDS U.S. Health Care Select 10 OTR Index & S&P/ISDA CDS European Banks Select 15 Index. They are trading significantly cheaper than the homebuilders and consumer discretionary sectors.

To summarize, CDS markets show that market participants are feeling warmer about the idea that underlying assets won’t default across the board than in May, but are keeping a coat nearby for certain sectors

The posts on this blog are opinions, not advice. Please read our Disclaimers.

Building the Indian Skyline

Contributor Image
Utkarsh Agrawal

Associate Director, Global Research & Design

S&P Dow Jones Indices

Since the global recession in 2008, India has been witnessing a slower real growth. Despite being a labor surplus country, India lacks adequate infrastructure to sustain the growth of labor-intensive industries which provide employment to the unskilled to semi-skilled workforce. The Global Competitiveness Index published by World Economic Forum placed India on the 3rd position for the Market size and on the 85th position for the Infrastructure in its Global Competitiveness Report 2013-2014. It also mentioned that the most problematic factor for doing business among others is the inadequate supply of infrastructure.

The development of infrastructure in a growing economy like India is very important to increase and maintain the sustainable growth rate in its real GDP which was approximately 4.35% in 2013 according to the World Economic Outlook Database April, 2014 published by the International Monetary Fund. Though investment in infrastructure as a percentage of GDP has been increasing over the years, the actual investment for the 10th plan was 5.15% of GDP and the projection for the 11th plan was 7.55% of GDP. It has been projected to be 9.95% of GDP for the 12th plan.

In the coming years, development of infrastructure should be a priority. Traditionally major share in the infrastructure development was contributed by the public sector. More and more participation of the private sector under the Public-Private Partnership is desirable to satisfy the growing needs.

The S&P BSE Infrastructure Index is an effort to measure the progress of the listed infrastructure in India. It has a targeted count of 30 stocks. The index aims to create a diversified exposure with five distinct clusters: Utilities, Energy, Transportation, Telecommunications and the Non-Banking Financial Institutions which are categorized by the Reserve Bank of India (RBI) as an ‘Infrastructure Finance Company’ or derive major business revenue from Infrastructure Finance. The clusters are based on a combination of GICS sectors. It has given an annualized return of 5.11% as on April 30, 2014 since April 28, 2006.

Disclaimer: This data is provided for illustrative purposes. Past performance does not guarantee future results.

The posts on this blog are opinions, not advice. Please read our Disclaimers.