Get Indexology® Blog updates via email.

In This List

Is Mexico Still Attractive to Foreigners?

Rieger Report: Infrastructure Bonds

A New Eden, Or Fewer Excuses

Canadian Update

Commodities Mixed in May Might Pay

Is Mexico Still Attractive to Foreigners?

Contributor Image
Jaime Merino

Former Director, Asset Owners Channel

S&P Dow Jones Indices

In an environment of increasing rates, Mexico has not been left behind.  As seen in my last blog, since December 2015, Mexico’s Central Bank (Banxico) has increased the reference rate by 375 bps, with the last 25 bps being a surprise for analysts and the market on May 19, 2017.  I remember the days when everyone was saying that Banxico would move with the U.S. Fed, but as of the same date, the U.S. Fed has increased its reference rate by only 75 bps. Their next meeting is in June 2017, and many analysts estimate an increase of 25 bps.  Exhibit 1 shows the spread between the Mexican 10-Year Bond and the U.S. 10-Year Treasury Bond for the 10–year period ending May 29, 2017, along with the performance of the S&P/BMV Government MBONOS 5-10 Year Bond Index.

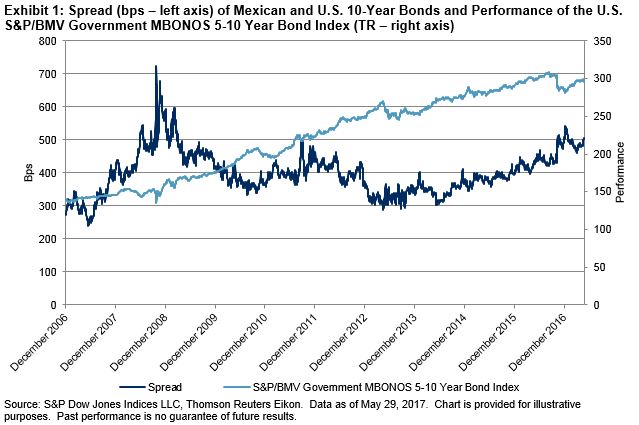
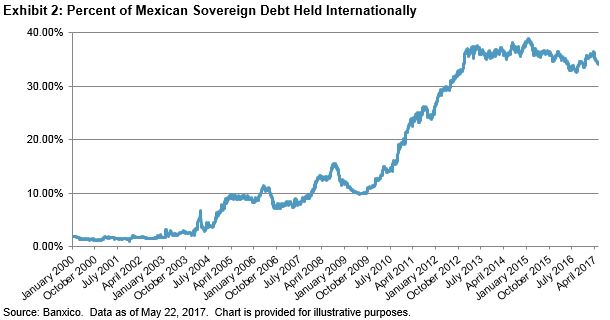
For the past three years, the spread trend has been positive, with the most recent data above 500 bps.  Has this affected the inflows and outflows for sovereign instruments?  People often talk about Mbonos (fixed-rate sovereign instruments) that are held by non-residents, but let’s dig further into other issuances and total assets.  First, Exhibit 2 shows the historical behavior of the total percentage of sovereign debt held outside of Mexico.  As of May 22, 2017, a little bit more than one-third was held outside the country.  We also see a rapid increase between 2010 and 2012, from nearly 10% to 35%.  Exhibit 3 shows the annual inflows and outflows, expressed in millions of Mexican pesos, from January 2000 to May 22, 2017.

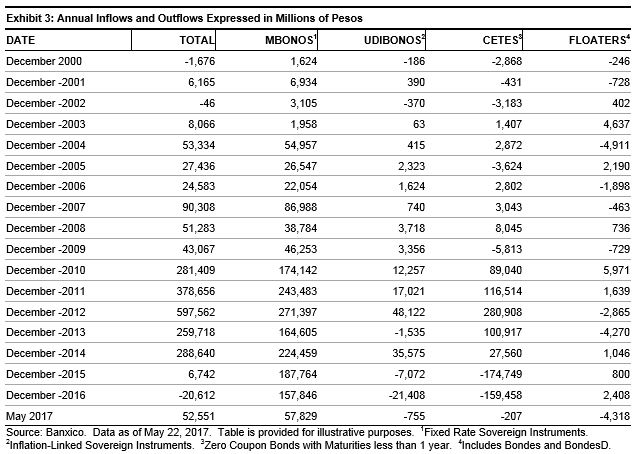
The trend for Mbonos is still positive, but by this time last year, the inflows were double what they are now.  For Udibonos and Cetes, the trend for the past three years has been downward, making 2016 the first year with total outflows since 2002.

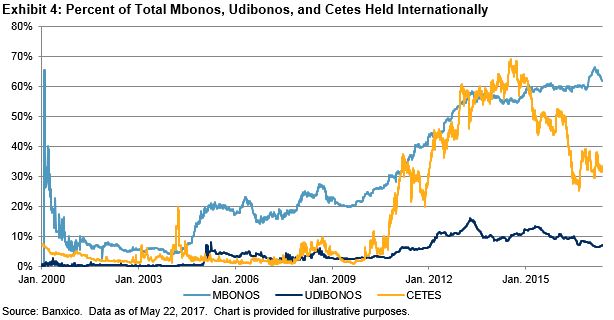
Exhibit 4 shows the percentage of Mbonos, Udibonos, and Cetes held by international market participants; note that since September 2012, one-half of the total Mbonos have been held internationally, and at one point non-resident holdings of Cetes hit nearly 70%.

Sovereign bonds are still attractive to foreigners, but not to the same degree as in 2010 to 2014, when the search for yield spiked.  Over the past few years, no new inflows were presented, and we can assume that the position from Cetes moved to Mbonos.  Inflation instruments might be more attractive now, since, as shown in my last post, inflation has increased significantly, reaching 5.86% year-over-year in April 2017.

For more information about the indices following these instruments, please see: S&P/BMV Government CETES Bond Index, S&P/BMV Government MBONOS 1-5 Year Bond Index, S&P/BMV Government MBONOS 5-10 Year Bond Index, S&P/BMV Government Inflation-Linked UDIBONOS 1+ Year Bond Index.

The posts on this blog are opinions, not advice. Please read our Disclaimers.

Rieger Report: Infrastructure Bonds

Contributor Image
J.R. Rieger

Former Head of Fixed Income Indices

S&P Dow Jones Indices

With the President’s focus on the U.S. infrastructure this coming week it is a good time to look at the existing infrastructure bond markets.  Municipal bonds have long played a critical funding role in the U.S. infrastructure sector.

The 19,000 tax-exempt municipal bonds tracked in the S&P  Municipal Bond Infrastructure Index mainly consist of investment grade bonds related to the transportation (roads, airports et al) and utility (water, sewer, power, resource recovery) segments of the market. As these are revenue bonds with slightly longer durations the average yield is naturally higher than the overall market, Year-to-date this group of bonds have outperformed the investment grade muni market.

On the taxable side of the market, the S&P Taxable Municipal Bond Infrastructure Index consists of bonds from the same segments as it’s tax-exempt counterpart.  These taxable bonds have a duration of over 10 years making them appealing for the institutional market. In addition,  the low supply of these investment grade bonds have created a scarcity value.  As a result this segment of the bond market enjoys both a higher yield and overall better year-to-date performance than U.S. corporate bonds tracked in the S&P 500 Bond Index.

Table:  Select indices, their yields and year-to-date returns as of June 2, 2017:

Source:: S&P Dow Jones Indices, LLC. Data as of June 2, 2017. Chart is provided for illustrative purposes. It is not possible to invest directly in an index. Past performance is no guarantee of future results.

For more information on S&P’s bond indices including methodologies and time series information please go to SPDJI.com.

Please join me on LinkedIn .

The posts on this blog are opinions, not advice. Please read our Disclaimers.

A New Eden, Or Fewer Excuses

Contributor Image
Tim Edwards

Managing Director, Index Investment Strategy

S&P Dow Jones Indices

In our May dispersion dashboard, we note that “If there is ever such thing as a “stock-pickers’ market”, then the month of May 2017 – at least in some regions – might be the closest approximation we have seen for a decade.”

The subject of what, exactly a “stock-pickers’ market” might look like, and how we would know when we are in one, has been a topic of extensive study and regular commentary.  First, we should explain what we mean by a “stock pickers’ market”.

One definition of a “stock pickers’ market” is a tailwind for concentrated bets, even if they are made by the unskilled investor.  Such an environment can be identified by the performance of equal-weight indices, since – if equal weight outperforms the cap-weighted benchmark then, by definition, the average stock outperforms.  The fortunes of concentrated portfolios, such as those maintained by a traditional stock-picker, are also impacted by the level of market skewness, among other factors of importance.

Alternatively, a “stock-pickers’ market” can mean that those stock-pickers with genuine skill (or luck) are particularly distinguished from those with less skill or less luck.  This is quite a different scenario to the one in which the “average” stock-picker is more likely to outperform – and with different characteristics:  

  1. First, it requires high dispersion: the difference between winners and losers should offer significant rewards to those who make the right calls.
  2. Second, it requires low correlations between different stocks: the stock picker prefers his picks to reflect the that characteristics made them more attractive than their peers in the first place, as opposed to shared drivers. This is different to high dispersion, although they often coincide.
  3. Third and finally, one would hope for low market volatility: the stock picker who outperforms the market, yet is whipped around along with it, has not only a more stressful experience (or at least his clients do), but also is provided with a less clear signal of his skills.

The charts below show the levels of dispersion, correlation and volatility recorded in the month of May in several of the major markets covered by S&P Dow Jones Indices.  The charts place each measurement in their historical context: the level for the most recent month is the coloured dot; the light grey bars represent the middle 90% of all observations in the past decade, while the dark grey bars represent the middle 50%.  A single black line represents the historical median:

In several of these regions, most notably in countries such as Australia and Japan, and in market segments such as U.S. small caps, as well as across the broad-based S&P Developed ex-U.S. LargeMid BMI universe, benchmark volatility and average stock correlations stand at or near record lows, while dispersion has risen  above average.

Raising the stakes, May was also a month in which there were headwinds for the unlucky, and the unskilled.  As reported in our standard dashboards, equal-weight indices under-performed in the U.S. and in Europe, while smaller stocks outperformed the very largest more generally across Asia.

What does this mean for active mangers?  The month of May, 2017 provided an example of market circumstances favouring the skillful or lucky stock-picker, but not the average.  And while one swallow does not make a summer, if such an environment should persist through the rest of the year, then there will be fewer excuses for poor performance at the end of it.

The posts on this blog are opinions, not advice. Please read our Disclaimers.

Canadian Update

Contributor Image
Kevin Horan

Former Director, Fixed Income Indices

S&P Dow Jones Indices

Canada’s economy has been accelerating due to increased consumer spending and a rebound in business investment.  Consumer spending driven by vehicle purchases and real estate investment has lifted the economy, along with improved business investment.  The economy and its growth trend now appear to be on a more secure path.  As of May 31, 2017, the S&P/TSX Composite returned 1.50% YTD on a total return basis.

Such growth should eventually lead to an increase in overall prices, which to date has not occurred.  The CPI, as measured by Statistics Canada, was valued at 1.6% for April 2017.  In the near future, more eyes will be on the CPI and the S&P Canada Sovereign Inflation-Linked Bond Index, which returned 1.96% YTD as of May 31, 2017.

Given such an outlook, the Bank of Canada might be moving closer to an interest rate hike.  As of May 31, 2017, the yield of the S&P Current 2-Year Canada Sovereign Bond Index was just 0.7%, compared with the U.S. two-year Treasury Bond yield of 1.28%, as the U.S. Fed contemplated an additional rate hike as soon as June 2017.

The Canadian dollar, also endearingly known as the “loonie” after the bird on the currency, has been and continues to be weak against the U.S. dollar.  Canada’s many lakeside resorts and destinations should be a bargain to many vacationing U.S. residents this summer.

Exhibit 1: Canadian to U.S. Dollar Exchange Rate

Source: Google; SIX Financial Information. Chart is provided for illustrative purposes.


The S&P Canada Investment Grade Corporate Bond Index has had consistently positive returns each month this year.  As of May 31, 2017, the index returned 3.19% YTD.  The sectors of the Canadian bond market vary, with financials (59.1%) and energy (10.4%) dominating in terms of market value weight, though their returns for the month, at 0.15% and 0.21%, respectively, lagged behind the leading sectors of health care, at 1.95%, and industrials, at 1.38%.

Exhibit 2: Index Weights and Performance

Source: S&P Dow Jones Indices LLC. Data as of May 31, 2017. Past performance is no guarantee of future results. Table is provided for illustrative purposes.


The posts on this blog are opinions, not advice. Please read our Disclaimers.

Commodities Mixed in May Might Pay

Contributor Image
Jodie Gunzberg

Former Managing Director, Head of U.S. Equities

S&P Dow Jones Indices

No single sector dominated commodity performance in May, which means the supply-side is currently more potent than macro factors like global aggregate demand, the dollar, interest rates or inflation.  Each commodity is being driven by something in its own supply/demand model, mostly unrelated to one another.  That is not just lowering the intra-commodity correlation that can create buying opportunities but has lowered the correlation between stocks and commodities, bringing to light the important role commodities can play in diversification.

In May, the Dow Jones Commodity Index Total Return fell 1.7% bringing its year-to-date performance to -5.3%, and the S&P GSCI Total Return fell 1.5%, pushing down its year-to-date performance to -8.5%.  While livestock (+4.4%) and precious metals (+0.4%) were the only positive sectors in the S&P GSCI, 9 of the 24 commodities were positive, and were from all the sectors.  Lean hogs (+12.1%,) cocoa (+11.3%) and unleaded gasoline (+3.0%) were the biggest winners while natural gas (+8.6%,) sugar (+7.7%) and lead (+6.2%) were the biggest losers.

Source: S&P Dow Jones Indices

This disparity is important since the supply-shocks supporting it comprise the factor (expectational variance) that drives low correlation in between commodities and also between commodities and other asset classes. Notice the stock-commodity (S&P 500 vs S&P GSCI) correlation has fallen from 0.5 to 0.04 this month, making commodities strong diversifiers again.

Source: S&P Dow Jones Indices

Not only is the diversification an important result but the supply issues matter to the inventory re-balancing process   In May, there were a record 9 new commodities with a positive roll return, reflecting backwardation from shortages.  There have never been this many commodities swinging simultaneously from negative to positive term structures, so that might be a bullish sign ahead of the summer.  However, the term structure hasn’t turned positive yet for unleaded gasoline despite its rise in May even in the face of falling oil.  Typically if Brent crude falls, unleaded gasoline falls slightly more with a down market capture ratio of 107, but when Brent crude rises unleaded gasoline typically increases with an up market capture 109.  If commodities of not just the same sector but the same component are decoupling, and Brent crude is not dragging down unleaded gasoline, not only is that bullish, but it makes a  more compelling diversification argument.

The posts on this blog are opinions, not advice. Please read our Disclaimers.